. 2013 May 23;38(5):1013-24.
doi: 10.1016/j.immuni.2013.03.012. Epub 2013 Apr 25.

Maturation of lymph node fibroblastic reticular cells from myofibroblastic precursors is critical for antiviral immunity

Affiliations

Maturation of lymph node fibroblastic reticular cells from myofibroblastic precursors is critical for antiviral immunity

Qian Chai et al. Immunity. .

Abstract

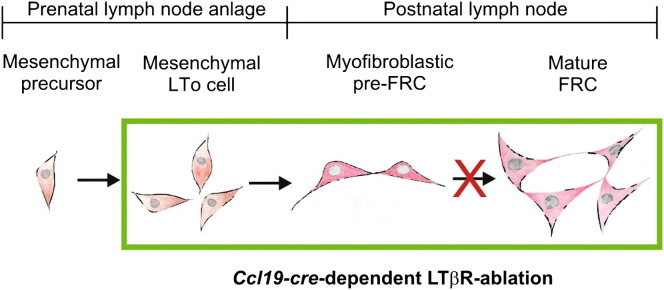
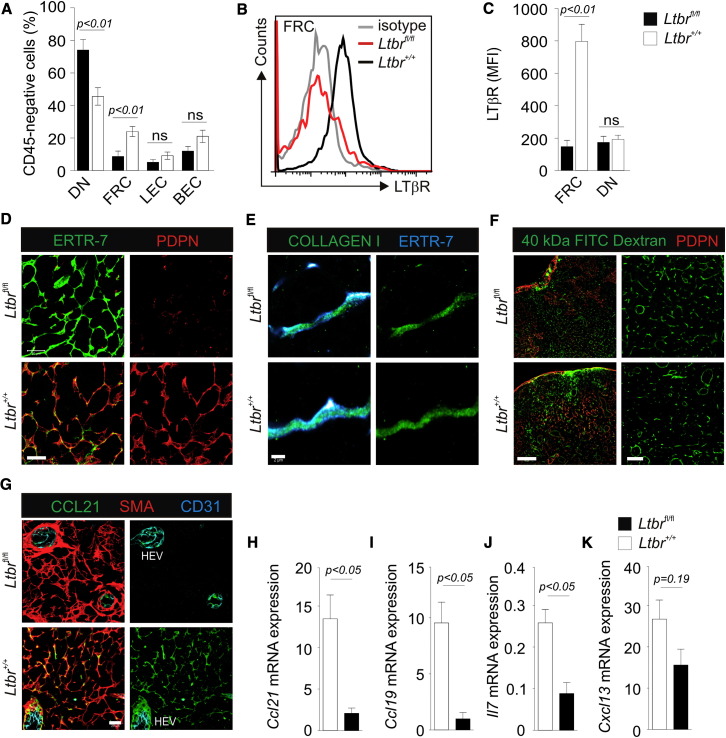
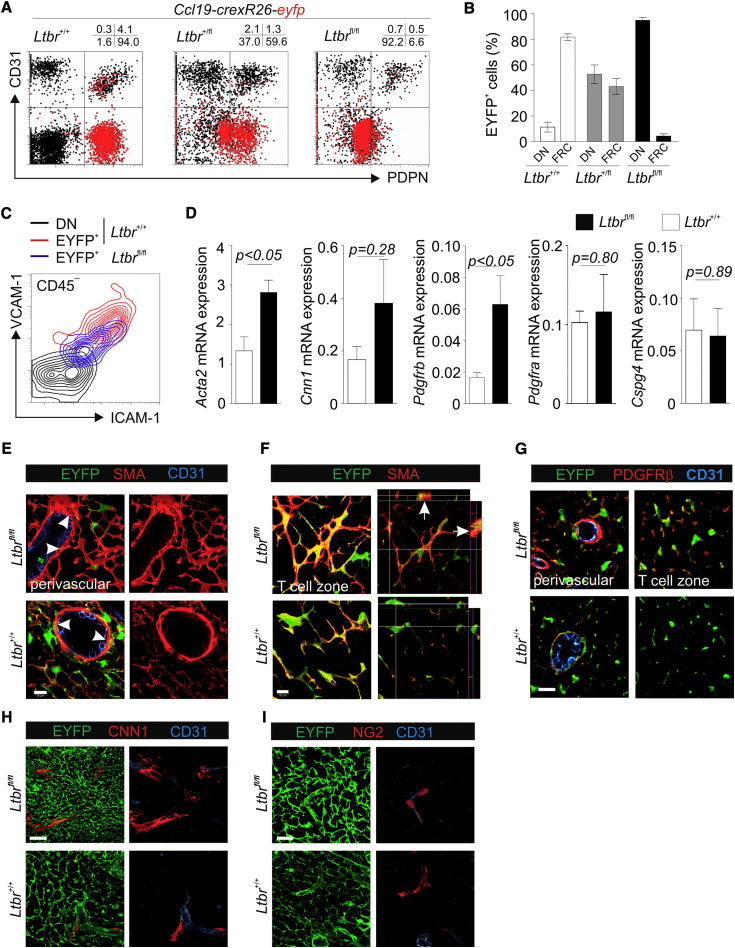
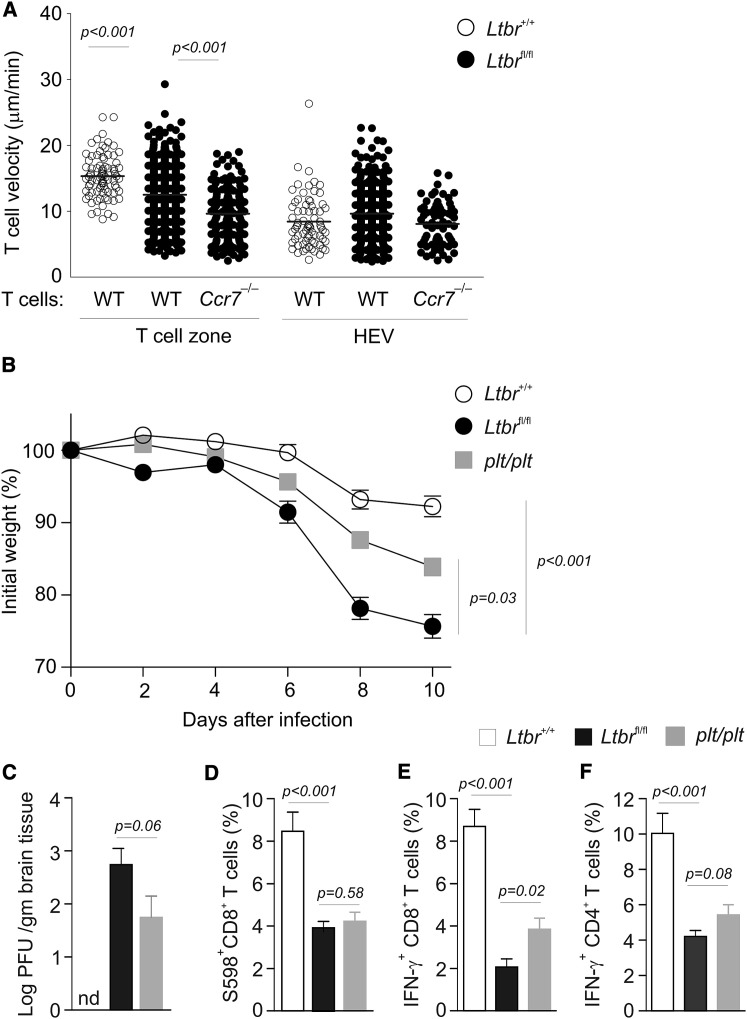
The stromal scaffold of the lymph node (LN) paracortex is built by fibroblastic reticular cells (FRCs). Conditional ablation of lymphotoxin-β receptor (LTβR) expression in LN FRCs and their mesenchymal progenitors in developing LNs revealed that LTβR-signaling in these cells was not essential for the formation of LNs. Although T cell zone reticular cells had lost podoplanin expression, they still formed a functional conduit system and showed enhanced expression of myofibroblastic markers. However, essential immune functions of FRCs, including homeostatic chemokine and interleukin-7 expression, were impaired. These changes in T cell zone reticular cell function were associated with increased susceptibility to viral infection. Thus, myofibroblasic FRC precursors are able to generate the basic T cell zone infrastructure, whereas LTβR-dependent maturation of FRCs guarantees full immunocompetence and hence optimal LN function during infection.


Figures

None
Graphical abstract
Figure 1
Figure 1
Ccl19-cre Transgene Expression in LN Stromal Cells (A) LN cell suspensions from 6-week-old Ccl19-cre × R26-eyfp mice were depleted of CD45+ cells, and EYFP expression was determined by flow cytometry. (B) Representative dot plot analysis with quadstat values of CD31 and PDPN expression in CD45 inguinal LN stromal cells. (C) Dot plot analysis including quadstat values of CD31 and PDPN expression in CD45EYFP+ LN stromal cells. (D) EYFP expression in CD45 LN stromal cell populations (PDPN+CD31 fibroblastic reticular cells [FRC]; PDPNCD31 double-negative [DN] cells; PDPN+CD31+ lymphatic endothelial cells [LECs]; PDPNCD31+ blood endothelial cells [BEC]). Inguinal LNs from individual mice were pooled, mean values ± SEM from 15 mice analyzed in three independent experiments. (E) Confocal microscopic analysis of an Ccl19-cre × R26-eyfp inguinal LN section by using antibodies against the indicated markers, merged channels in left panel; scale bar represents 200 μm. (F) 3D reconstruction of T cell zone FRC network, merged channels in left panel, scale bar = 10 μm. (G) EYFP expression in perivascular FRCs (arrow); scale bar represents 20 μm. (H and I) Expression of the homeostatic chemokines CCL21 (H, arrows) and CCL19 (I, arrows) in EYFP+ FRCs in T cell zones of Ccl19-cre × R26-eyfp inguinal LNs; scale bar represents 20 μm. See also Figure S1.
Figure 2
Figure 2
Characterization of Ccl19-cre+ Mesenchymal Stromal Cells in Developing LNs (A–E) Ccl19-cre × R26-eyfp embryos were analyzed for transgene expressing cells in inguinal LN anlagen by confocal microscopy at embryonic days E16.5 (A) and E18.5 (B) by using the indicated stainings. Left panels show merge of all channels; scale bars represent 100 μm. Inguinal LNs from neonatal, 2- and 6-week-old Ccl19-cre mice were analyzed by quantitative RT-PCR for the expression of Ccl19 (C), Cre recombinase (D), and Ltbr (E). Values indicate mean ± SEM from two individual LNs from three mice analyzed in two independent experiments. (F) Confocal microscopic analysis with single and combined stainings for the indicated markers of neonatal inguinal LNs from Ccl19-cre × R26-eyfp mice (confocal plane in left panels). Maximum intensity projection (3D) from z stack (upper right panel) and magnified 3D rendering of fibroblastic network (lower right panel, represents boxed area in upper panel); scale bars represent 100 μm. (G) Expression of the smooth muscle actin (SMA) and platelet-derived growth factor receptor-β (PDGFRβ) in neonatal inguinal LNs from Ccl19-cre × R26-eyfp mice; scale bar represents 10 μm. (H) Neonatal inguinal LNs from conditionally LTβR-deficient Ccl19-cre × R26-eyfp mice analyzed by confocal microscopy (confocal plane in left panels) with maximum intensity projection (3D) from z stack (upper right panel) and magnified 3D rendering of fibroblastic network (lower right panel, represents boxed area in upper panel); scale bars represent 100 μm. (I) Expression of SMA and PDGFRβ in conditionally LTβR-deficient neonatal inguinal LNs; scale bar represents 10 μm. Representative data from one out of three independent experiments. See also Figure S2.
Figure 3
Figure 3
Impact of FRC-Specific LTβR Signaling on Peripheral LN Structure (A) Inguinal LNs from 4-week-old Ccl19-cre × Ltbrfl/fl and Ltbr+/+ controls were analyzed by OPT for the presence of the HEV network (MECA-79+) and B cell follicles (B220+); scale bar represents 500 μm. Quantitative analysis based on OPT data for (B) LN volume, (C) B cell follicle volume, (D) HEV network length, and (E) HEV branching points (mean ± SEM, n = 6 mice pooled from two independent experiments). (F) Confocal microscopic analysis of inguinal LNs from 4-week-old Ccl19-cre × Ltbrfl/fl and Ltbr+/+ controls by using antibodies against T cells (CD4) and B cells (B220); scale bar represents 200 μm. (G) Flow cytometry-based quantification of LN cellularity. Values indicate relative cell numbers in Ccl19-cre × Ltbrfl/fl mice compared to Ltbr+/+ mice (CD4, CD4+ T cells; CD8, CD8+ T cells; BC, B cells; DC, dendritic cells; MP, macrophages; mean ± SEM, n = 6 mice from two independent experiments).
Figure 4
Figure 4
FRC-Specific LTβR Ablation Alters LN Stromal Cell Composition and Phenotype (A) Frequency of the major stromal cell populations (PDPNCD31 DN cells, PDPN+CD31 [FRC], PDPN+CD31+ [LEC]; PDPNCD31+ [BEC]) in inguinal LNs from Ccl19-cre × Ltbrfl/fl and Ltbr+/+ mice as determined by flow cytometry; values represent mean ± SEM (n = 9 mice from three independent experiments). (B) Representative LTβR expression patterns on PDPN+CD31 (FRC) stromal cells of Ccl19-cre × Ltbrfl/fl (red) and Ltbr+/+ (black) mice determined by flow cytometry; staining with isotype control antibody in gray. (C) Summary of LTβR expression displayed as mean fluorescent intensity (MFI), mean ± SEM (n = 4 mice from two independent experiments). (D–G) Confocal microscopic analysis of inguinal LN stromal cells from 6-week-old Ccl19-cre × Ltbrfl/fl and Ltbr+/+ controls. (D) T cell zone reticular network revealed by ERTR-7 and PDPN staining, merged channels in left panel; scale bar represents 20 μm. (E) High-resolution analysis of T cell zone conduit with collagen-1 bundles ensheathed by ERTR-7; scale bar represents 2 μm. (F) Drainage of 40 kDa FITC dextran through LN conduits 2 min after subcutaneous injection. Left panel shows magnified FITC staining in T cell zone; scale bar represents 100/40 μm. (G) Vascular (HEV, high endothelial venule) and T cell zone stromal cell-associated CCL21 expression, merged channels in left panel, CD31 and CCL21 merge in right panel; scale bar represents 20 μm. (H–K) Inguinal LNs from 6-week-old Ccl19-cre × Ltbrfl/fl and Ltbr+/+ controls were analyzed by quantitative RT-PCR for the expression of Ccl21 (H), Ccl19 (I), Il7 (J), and Cxcl13 (K). Values indicate mean ± SEM from two individual LNs from three mice analyzed in two independent experiments.
Figure 5
Figure 5
LTβR-Dependent FRC Maturation (A) LN stromal cells from 6-week-old Ccl19-cre × R26-eyfp mice with wild-type (+/+, WT) and heterozygously (+/fl) or homozygously floxed (fl/fl) Ltbr loci were assessed by flow cytometry for EYFP expression by using back gating. Representative dot plot analysis with quadstat values of CD31 and PDPN expression is shown. (B) EYFP expression in FRCs and DN cells in the indicated Ltbr genotype of Ccl19-cre × R26-eyfp mice; mean ± SEM (n = 3 mice from two independent experiments). (C) Representative analysis of ICAM-1 and VCAM-1 expression on Ltbr+/+ DN cells from Ccl19-cre × R26-eyfp mice (black), EYFP+Ltbr+/+ FRCs of Ccl19-cre × R26-eyfp mice (red), and EYFP+ cells of Ccl19-cre × R26-eyfpxLtbrfl/fl mice (blue). (D) Inguinal LNs from 6-week-old Ccl19-cre × Ltbrfl/fl and Ltbr+/+ controls were analyzed by quantitative RT-PCR for the expression of Acta2 (SMA), Cnn1 (Calponin-1), Pdgfrb, Pdgfra, and Cspg4 (NG2). Values indicate mean ± SEM from two individual LNs from >3 mice analyzed in two independent experiments. (E–I) Confocal microscopic analysis of inguinal LN stromal cells from 6-week-old Ccl19-cre × R26-eyfpxLtbrfl/fl mice and Ltbr+/+Ccl19-cre × R26-eyfp controls. Reconstruction of perivascular (E) and T cell zonal (F) stromal cell network by analyzing CD31, SMA, and EYFP expression is shown. Arrowheads indicate perivascular EYFP expression, arrows indicate SMA+EYFP+ cells in orthogonal sections, and scale bars represent 10 μm. (G) Analysis of perivascular and T cell zonal expression of EYFP and PDGFRβ; scale bar represents 20 μm, all panels show merged channels. Reconstruction of perivascular and network-forming cells expressing CNN1 (H) and NG2 (I) and EYFP, merged channels in left panels; scale bars represent 30 μm; representative data out of three independent experiments. See also Figure S3.
Figure 6
Figure 6
T Cell Function in the Absence of FRC-Specific LTβR Signaling (A) Motility of T cells from C57BL/6N (WT) or CCR7-deficient donors in the T cell zone and around HEVs in popliteal LNs of Ccl19-cre × Ltbrfl/fl (closed symbols) and Ltbr+/+ (open symbols) mice as determined by intravital two-photon microscopy. Values represent single tracks pooled from two independent experiments (n = 4 mice, mean indicated by horizontal bar). (B–D) Ccl19-cre × Ltbrfl/fl, Ltbr+/+, and plt/plt mice were infected intranasally with 5 × 104 pfu of MHV A59. (B) Weight loss was recorded during the indicated time period following infection. Values indicate mean percentage of the initial weight ± SEM (n = 8 mice per group, one-way ANOVA with Tukey's post test). (C) Viral titers in brain homogenates were determined at day 10 postinfection. Data represent mean viral titers ± SEM, pooled data from two independent experiments (n = 8 mice); nd, not detectable. (D) T cell responses were determined by tetramer analysis of CNS-infiltrating S598-specific CD8+ T cells (left panel) and intracellular staining for S598-responsive IFN-γ-producing CD8+ T cells (middle panel), and M133-responsive IFN-γ-producing CD4+ T cells (right panel) on day 10 post infection. Values indicate mean percentages ± SEM of specific cells in the respective CD8+ or CD4+ T cell population (n = 8 mice per group). See also Figure S4. (D–F) T cell responses were determined by tetramer analysis of CNS-infiltrating S598-specific CD8+ T cells (D) and intracellular staining for S598-responsive IFN-γ-producing CD8+ T cells (E), and M133-responsive IFN-γ-producing CD4+ T cells (F) on day 10 postinfection. Values indicate mean percentages ±SEM of specific cells in the respective CD8+ or CD4+ T cell population (n = 8 mice per group).

Comment in

Similar articles

Cited by

References

    1. Adachi S., Yoshida H., Honda K., Maki K., Saijo K., Ikuta K., Saito T., Nishikawa S.I. Essential role of IL-7 receptor alpha in the formation of Peyer’s patch anlage. Int. Immunol. 1998;10:1–6. - PubMed
    1. Bajénoff M., Egen J.G., Koo L.Y., Laugier J.P., Brau F., Glaichenhaus N., Germain R.N. Stromal cell networks regulate lymphocyte entry, migration, and territoriality in lymph nodes. Immunity. 2006;25:989–1001. - PMC - PubMed
    1. Bénézech C., White A., Mader E., Serre K., Parnell S., Pfeffer K., Ware C.F., Anderson G., Caamaño J.H. Ontogeny of stromal organizer cells during lymph node development. J. Immunol. 2010;184:4521–4530. - PMC - PubMed
    1. Bergmann C.C., Lane T.E., Stohlman S.A. Coronavirus infection of the central nervous system: host-virus stand-off. Nat. Rev. Microbiol. 2006;4:121–132. - PMC - PubMed
    1. Boos M.D., Yokota Y., Eberl G., Kee B.L. Mature natural killer cell and lymphoid tissue-inducing cell development requires Id2-mediated suppression of E protein activity. J. Exp. Med. 2007;204:1119–1130. - PMC - PubMed

Publication types

MeSH terms