. 2013 Jun 15;19(12):3153-64.
doi: 10.1158/1078-0432.CCR-13-0330. Epub 2013 Apr 25.

Receptor affinity and extracellular domain modifications affect tumor recognition by ROR1-specific chimeric antigen receptor T cells

Affiliations

Receptor affinity and extracellular domain modifications affect tumor recognition by ROR1-specific chimeric antigen receptor T cells

Michael Hudecek et al. Clin Cancer Res. .

Abstract

Purpose: The adoptive transfer of T cells modified to express a chimeric antigen receptor (CAR) comprised of an extracellular single-chain antibody (scFV) fragment specific for a tumor cell surface molecule, and linked to an intracellular signaling module, has activity in advanced malignancies. The receptor tyrosine kinase-like orphan receptor 1 (ROR1) is a tumor-associated molecule expressed in prevalent B-lymphoid and epithelial cancers and is absent on normal mature B cells and vital tissues, making it a candidate for CAR T-cell therapy.

Experimental design: We constructed ROR1-CARs from scFVs with different affinities and containing extracellular IgG4-Fc spacer domains of different lengths, and evaluated the ability of T cells expressing each CAR to recognize ROR1(+) hematopoietic and epithelial tumors in vitro, and to eliminate human mantle cell lymphoma (MCL) engrafted into immunodeficient mice.

Results: ROR1-CARs containing a short "Hinge-only" extracellular spacer conferred superior lysis of ROR1(+) tumor cells and induction of T-cell effector functions compared with CARs with long "Hinge-CH2-CH3" spacers. CARs derived from a higher affinity scFV conferred maximum T-cell effector function against primary CLL and ROR1(+) epithelial cancer lines in vitro without inducing activation-induced T-cell death. T cells modified with an optimal ROR1-CAR were equivalently effective as CD19-CAR-modified T cells in mediating regression of JeKo-1 MCL in immunodeficient mice.

Conclusions: Our results show that customizing spacer design and increasing affinity of ROR1-CARs enhances T-cell effector function and recognition of ROR1(+) tumors. T cells modified with an optimized ROR1-CAR have significant antitumor efficacy in a preclinical model in vivo, suggesting they may be useful to treat ROR1(+) tumors in clinical applications.


Conflict of interest statement

Conflict of interest disclosure: The authors declare no relevant conflicts of interest.

Figures

Figure 1
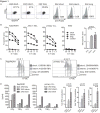
Figure 1. In vitro cytotoxicity, cytokine production, and proliferation of T-cells modified to express 2A2 ROR1-CARs with modified spacer length
(A) Phenotype of purified CD8+ TCM-derived cell lines modified with each of the 2A2 ROR1-CARs with long, intermediate and short spacer domain. Staining with anti-F(ab) antibody that binds to an epitope in the 2A2 scFV shows surface expression of ROR1-CARs with full length or truncated spacer. (B) Cytolytic activity of T-cells expressing the various 2A2 ROR1-CARs with long, intermediate and short spacer, or a tEGFR control lentiviral vector against ROR1+ and control target cells. The bar diagram summarizes cytotoxicity data from 3 independent experiments (E:T = 30:1) normalized to cytolytic activity by 2A2 ROR1-CAR ‘long’ = 1, and analyzed by Student's t-test. (C) CFSE dye dilution was used to measure proliferation of 2A2 ROR1-CAR and tEGFR control T-cells, 72 hours after stimulation with Raji/ROR1 (left panel) and primary CLL cells (right panel) without addition of exogenous cytokines. For analysis, triplicate wells were pooled and the proliferation of live (PI-), CD8+ T-cells analyzed. Numbers above each histogram indicate the number of cell divisions the proliferating subset underwent, and the fraction of T-cells in each gate that underwent ≥4/3/2/1 cell divisions is provided next to each plot. (D) Multiplex cytokine assay of supernatants obtained after 24 hours from triplicate co-cultures of 5×10⁴ T-cells expressing the various 2A2 ROR1-CARs with Raji/ROR1 and primary CLL cells. Multiplex cytokine data from 3 independent experiments were normalized (cytokine release by 2A2 ROR1-CAR ‘long’ = 1) and analyzed by Student's t-test (right bar diagram).
Figure 2
Figure 2. Anti-tumor reactivity of T-cells modified with ROR1-CARs derived from mAb R12 with higher affinity than 2A2
(A) tEGFR expression on purified polyclonal CD8+ TCM-derived T-cell lines modified with each of the R12 and 2A2 ROR1-CARs with short IgG4-Fc ‘Hinge’ spacer, and CD28 or 4-1BB costimulatory domain. (B) Cytotoxicity against ROR1+ and control target cells by T-cells expressing R12 and 2A2 ROR1-CARs or a tEGFR control vector. (C) Multiplex cytokine assay of supernatants obtained after 24 hours from co-cultures of 5×10⁴ T-cells expressing the various ROR1-CARs with Raji/ROR1 tumor cells. The middle/right bar diagrams show normalized multiplex data from 3 independent experiments (cytokine release by ROR1-CAR 2A2 = 1) analyzed by Student's t-test. (D) Proliferation of ROR1-CAR T-cells and tEGFR control T-cells 72 hours after stimulation with Raji/ROR1 cells and without addition of exogenous cytokines was assessed by CFSE dye dilution. Numbers above each histogram indicate the number of cell divisions the proliferating subset underwent, and the fraction of T-cells in each gate that underwent ≥4/3/2/1 cell divisions is provided above each plot.
Figure 3
Figure 3. Recognition of primary CLL by T-cells modified with 2A2 and R12 ROR1-CARs with optimal short spacer and 4-1BB costimulatory domain or with a CD19-specific CAR
(A) Expression of ROR1/CD19 on primary CLL, and CD80/86 on primary CLL and Raji/ROR1 tumor cells (black dot plots) that can engage CD28 on CAR T-cells (black histograms). Staining with matched isotype control mAbs is shown as grey dot plots/histograms. (B) Cytolytic activity of T-cells expressing the 2A2 and R12 ROR1-CAR, a CD19-specific CAR and T-cells modified with a tEGFR control vector against primary CLL (left diagram) and normal B cells (right diagram) analyzed by chromium release assay. Cytotoxicity data against primary CLL from 4 independent experiments (E:T = 30:1) were normalized (cytolytic activity by ROR1-CAR 2A2 = 1) and analyzed by Student's t-test (bar diagram). (C) Multiplex cytokine analysis after a 24 hour stimulation of 5×10⁴ CAR T-cells with primary CLL cells. Cytokine release of unstimulated CAR T-cells was below 3.6 pg/mL (detection limit) (left bar diagram). ELISA for IFN-γ production by 5×10⁴ 2A2 and R12 ROR1-CAR T-cells after a 24-hour co-culture with primary CLL. O.D. of 1 corresponds to approximately 250 pg/mL (right bar diagram). (D) Proliferation of CD8+ T-cells modified with the 2A2 ROR1, R12 ROR1 and a CD19-CAR, 72 hours after stimulation with primary CLL cells. Numbers above each histogram indicate the number of cell divisions, and the fraction of T-cells in each gate that underwent ≥3/2/1 cell divisions is provided next to each plot.
Figure 4
Figure 4. In vivo anti-tumor efficacy of 2A2 ROR1, R12 ROR1 and CD19-CAR T-cells
Cohorts of mice were inoculated with 0.5×10⁶ JeKo-1/ffluc MCL via tail vein injection, and 5×10⁶ 2A2 ROR1, R12 ROR1 or CD19-CAR T-cells, or T-cells expressing a tEGFR control vector were administered 7 days after tumor inoculation. All CAR constructs had the short IgG4 ‘Hinge-only’ spacer and a 4-1BB costimulatory domain. (A, B) Serial bioluminescence imaging of tumor in cohorts of mice treated with T-cells expressing the 2A2 ROR1-CAR, the high affinity R12 ROR1-CAR, a CD19-specific CAR, with T-cells transduced with tEGFR alone, and untreated mice. Bioluminescence imaging showed tumor manifestations in the bone marrow and thorax and thus, signal intensity was measured in regions of interest that encompassed the entire body and thorax of each individual mouse. (C) Kaplan-Meier analysis of survival in individual treatment and control groups. Statistical analyses were performed using the log-rank test. The data shown in A-C are representative of results obtained in 2 independent experiments. (D) Proliferation of 2A2 ROR1, R12 ROR1 and CD19-CAR T-cells in vivo. Tumor bearing NSG/JeKo-1 mice received a single dose of 5×10⁶ CFSE-labeled 2A2 ROR1, R12 ROR1 or CD19-CAR T-cells on day 7 after tumor inoculation, and 72 h later peripheral blood, bone marrow and spleen were collected from each individual mouse. The frequency and proliferation of live (PI-), CD45+ CD8+ tEGFR+ T-cells was analyzed. The frequency of 2A2 ROR1, R12 ROR1 and CD19-CAR T-cells respectively is provided on the left of each histogram as percentage of live cells, and the fraction of T-cells that underwent ≥4/3/2/1 cell divisions is provided above each plot.
Figure 5
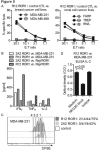
Figure 5. ROR1-CAR modified T-cells recognize ROR1+epithelial tumor cells in vitro
(A) Chromium release assay to evaluate the cytolytic activity of R12 ROR1-CAR modified T-cells (short spacer/4-1BB domain, closed symbols) and tEGFR control T-cells (open symbols) against ROR1+ breast cancer and renal cell cancer lines. (A-D) The 2A2 and R12 ROR1-CARs had the optimal short spacer and a 4-1BB costimulatory domain. (B) Multiplex cytokine analysis after stimulation of T-cells expressing the 2A2 and R12 ROR1-CAR with MDA-MB-231 and Raji/ROR1 tumor cells. (C) Proliferation of CD8+ T-cells modified with the 2A2 and R12 ROR1-CAR 72 hours after stimulation with MDA-MB-231 tumor cells. For analysis, triplicate wells were pooled and the proliferation of live (PI-), CD8+ T-cells analyzed. Numbers above each histogram indicate the number of cell divisions the proliferating subset underwent, and the fraction of T-cells in each gate that underwent ≥4/3/2/1 cell divisions is provided next to each histogram. (D) ELISA for IL-2 production by R12 ROR1-CAR T-cells after a 24-hour co-culture with MDA-MB-231 in plain medium, and after addition of an antibody cocktail blocking of the NKG2D pathway [anti-NKG2D (clone 1D11), anti-MICA/B (clone 6D4) and anti-ULBP] or matched isotype control mAbs. O.D. of 0.6 corresponds to approximately 1900 pg/mL.

Similar articles

Cited by

References

    1. Kalos M, Levine BL, Porter DL, Katz S, Grupp SA, Bagg A, et al. T cells with chimeric antigen receptors have potent antitumor effects and can establish memory in patients with advanced leukemia. Sci Transl Med. 2011;3:95ra73. - PMC - PubMed
    1. Kochenderfer JN, Dudley ME, Feldman SA, Wilson WH, Spaner DE, Maric I, et al. B-cell depletion and remissions of malignancy along with cytokine-associated toxicity in a clinical trial of anti-CD19 chimeric-antigen-receptor-transduced T cells. Blood. 2012;119:2709–20. - PMC - PubMed
    1. Kochenderfer JN, Wilson WH, Janik JE, Dudley ME, Stetler-Stevenson M, Feldman SA, et al. Eradication of B-lineage cells and regression of lymphoma in a patient treated with autologous T cells genetically engineered to recognize CD19. Blood. 2010;116:4099–102. - PMC - PubMed
    1. Morgan RA, Dudley ME, Wunderlich JR, Hughes MS, Yang JC, Sherry RM, et al. Cancer regression in patients after transfer of genetically engineered lymphocytes. Science. 2006;314:126–9. - PMC - PubMed
    1. Porter DL, Levine BL, Kalos M, Bagg A, June CH. Chimeric antigen receptor-modified T cells in chronic lymphoid leukemia. N Engl J Med. 2011;365:725–33. - PMC - PubMed

Publication types

MeSH terms

Substances