. 2014 May;68(6):1521-52.
doi: 10.1007/s00285-013-0678-2. Epub 2013 Apr 26.

Modelling the regulation of telomere length: the effects of telomerase and G-quadruplex stabilising drugs

Affiliations

Modelling the regulation of telomere length: the effects of telomerase and G-quadruplex stabilising drugs

Bartholomäus V Hirt et al. J Math Biol. 2014 May.

Abstract

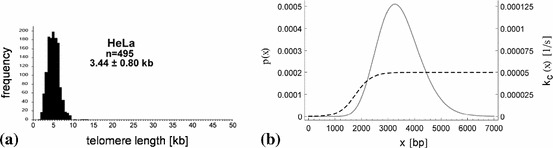
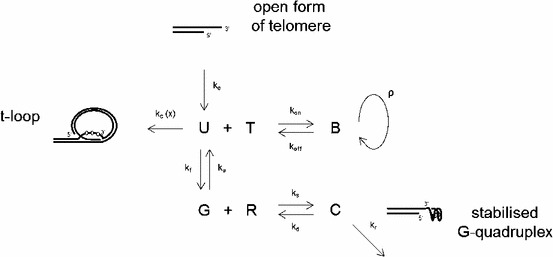
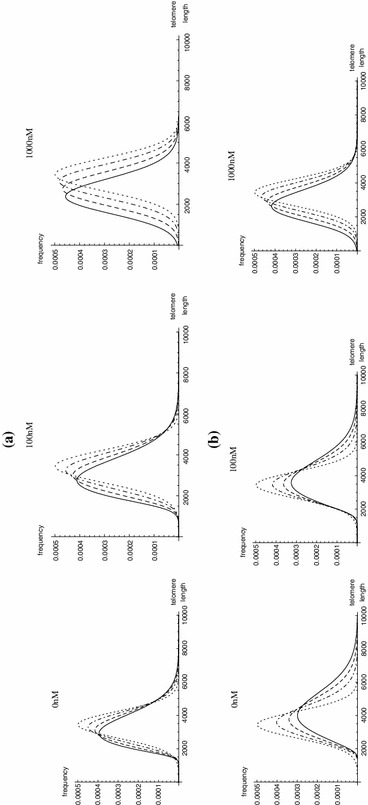
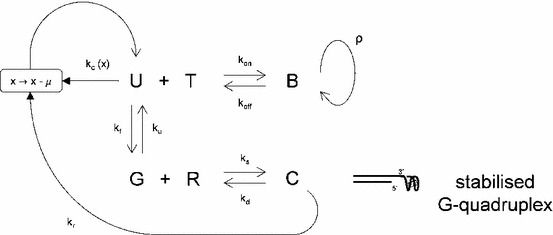
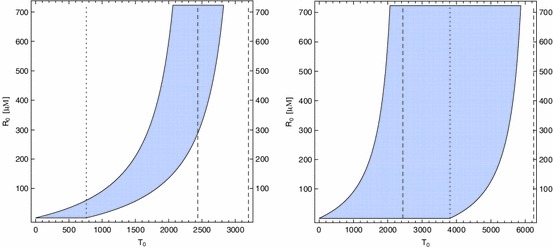
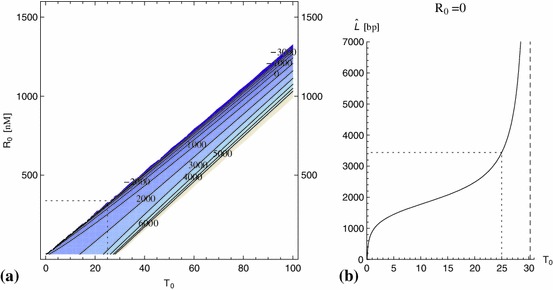
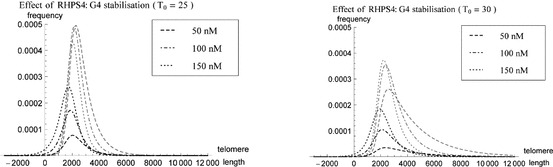
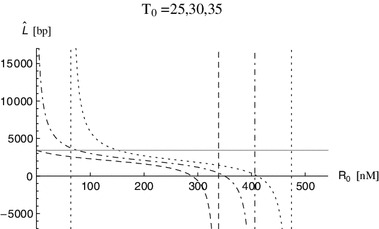
Telomeres are guanine-rich sequences at the end of chromosomes which shorten during each replication event and trigger cell cycle arrest and/or controlled death (apoptosis) when reaching a threshold length. The enzyme telomerase replenishes the ends of telomeres and thus prolongs the life span of cells, but also causes cellular immortalisation in human cancer. G-quadruplex (G4) stabilising drugs are a potential anticancer treatment which work by changing the molecular structure of telomeres to inhibit the activity of telomerase. We investigate the dynamics of telomere length in different conformational states, namely t-loops, G-quadruplex structures and those being elongated by telomerase. By formulating deterministic differential equation models we study the effects of various levels of both telomerase and concentrations of a G4-stabilising drug on the distribution of telomere lengths, and analyse how these effects evolve over large numbers of cell generations. As well as calculating numerical solutions, we use quasicontinuum methods to approximate the behaviour of the system over time, and predict the shape of the telomere length distribution. We find those telomerase and G4-concentrations where telomere length maintenance is successfully regulated. Excessively high levels of telomerase lead to continuous telomere lengthening, whereas large concentrations of the drug lead to progressive telomere erosion. Furthermore, our models predict a positively skewed distribution of telomere lengths, that is, telomeres accumulate over lengths shorter than the mean telomere length at equilibrium. Our model results for telomere length distributions of telomerase-positive cells in drug-free assays are in good agreement with the limited amount of experimental data available.


Figures

Fig. 1
Fig. 1
a A HT Q-FISH histogram of the telomere length distribution of HeLa cells, where formula image nuclei were analysed, adapted from Canela et al. (2007), with permission from PNAS. b A gamma probability density function, formula image, for the telomere length in HeLa cells, with mean formula image bp and standard deviation formula image bp, that is with the parameters formula image and formula image, is indicated by the solid gray line. The rate of t-loop formation (see Sect. 3 and formula (1)), formula image, is modelled by a sigmoidal function of telomere length (dashed line) with shape parameters formula image bp, formula image bp and formula image. Shorter telomeres are more likely to be in an unlooped form than longer telomeres
Fig. 2
Fig. 2
Model of telomeric states U, B, G, C. Kinetics for each reaction are described by their rate constants formula image. Free telomerase (T) and the G4-stabilising drug (R) in the nucleus bind open forms (U) and G4 structures (G), respectively. Telomerase elongation occurs at rate formula image. Telomeres enter the system at rate formula image and exit the system due to t-loop formation at rate formula image and due to G4-stabilisation by a G4 ligand at rate formula image. Here, formula image is the length of a telomere. The transitions formula image-loop and formula image G-quadruplex are assumed to be irreversible, and only through replication telomeres could leave these states
Fig. 3
Fig. 3
Simulations of length probability density distributions formula image, for telomeres entering the open system at generations formula image (dotted, dot-dashed, dashed, solid line) for a formula image and b formula image, and different concentrations of RHPS4 (0, 100 and 1,000 nM). The initial mean telomere length (formula image) is assumed to be formula image bp and telomeres shorten by formula image nt each replication. The formula image-axis represents telomere length in units of basepairs, and the mean telomere lengths at generation formula image are 3,352 bp (4,439 bp), 3,114 bp (3,997 bp) and 2,475 bp (2,808 bp) at formula image (formula image) and for 0, 100 and 1,000 nM of RHPS4, respectively
Fig. 4
Fig. 4
A closed model of telomeric states U, B, G, C, with telomeres of length formula image losing formula image basepairs when they exit the system by t-loop formation (rate formula image) or after forming a complex with RHPS4 (rate formula image); telomeres re-enter the system in the open (U) form. Kinetics for each reaction are described by their rate constants formula image. Free telomerase (T) and RHPS4 (R) in the nucleus bind open telomere forms (U) and G4 structures (G), respectively. Telomerase elongation occurs at rate formula image in the bound state, B
Fig. 5
Fig. 5
formula image-formula image-region of physical steady state solutions formula image for formula image (formula image, left plot) and formula image (formula image, right plot). The rate of telomerase-induced telomere synthesis is formula image. The lower (formula image) and upper (formula image) bounds on formula image are defined by (53) and (52), respectively, and there is no visible difference between the lower bound formula image and the larger lower bound formula image, defined by (54). The dotted line indicates the upper bound on telomerase, formula image, for the case of no drug and the two dashed lines in each plot indicate the lower (formula image) and upper (formula image) bounds on telomerase for large concentrations of RHPS4, where the values of formula image could not be distinguished from the values of formula image in these plots and are not shown
Fig. 6
Fig. 6
a Contour plot of the mean telomere length formula image in formula image space for formula image and formula image. The dotted lines indicates the best approximation for formula image such that formula image when formula image (formula image), and the according upper limit formula image. b A plot of the mean telomere length formula image of telomeres formula image exiting the system per unit time as a function of the number formula image of telomerase molecules for the case of no drug (formula image) in the system (formula image). The dotted lines indicate the value formula image and according value formula image
Fig. 7
Fig. 7
Simulations of telomere length probability density distribution formula image at steady state of the system (3)–(5), (26) per unit time for varying concentrations of RHPS4 (solid line formula image nM, dashed line formula image nM, dot-dashed line formula image nM, dotted line formula image nM) and the probability density distribution of the input telomere lengths, formula image (solid gray line, see Sect. 3.4 for more details). In all cases formula image and formula image (left plot) or formula image (right plot). The formula image-axis represents telomere length in units of basepairs
Fig. 8
Fig. 8
Proportions of the telomere length distribution formula image for telomeres formula image (gray lines) and formula image (black lines) and varying concentrations of RHPS4 (dashed line formula image nM, dot-dashed line formula image nM, dotted line formula image nM). In all cases formula image and formula image (left plot) or formula image (right plot). The formula image-axis represents telomere length in units of basepairs
Fig. 9
Fig. 9
A plot of the mean telomere length formula image of telomeres formula image exiting the system per unit time as a function of the concentration formula image of RHPS4 for three different numbers of telomerase molecules, formula image, represented by the dashed, dot-dashed and dotted line, respectively. The solid, gray line indicates the value formula image

Similar articles

Cited by

References

    1. Abdallah P, Luciano P, Runge KW, Lisby M, Geli V, Gilson E, Teixeira MT. A two-step model for senescence triggered by a single critically short telomere. Nat Cell Biol. 2009;11:988–993. doi: 10.1038/ncb1911. - DOI - PMC - PubMed
    1. Allsopp RC, Vaziri H, Patterson C, Goldstein S, Younglai EV, Futcher AB, Greidert CW, Harley CB. Telomere length predicts replicative capacity of human fibroblasts. Proc Natl Acad Sci USA. 1992;89:10114–10118. doi: 10.1073/pnas.89.21.10114. - DOI - PMC - PubMed
    1. Antal T, Blagoev KB, Trugman SA, Redner S. Aging and immortality in a cell proliferation model. J Theor Biol. 2007;248:411–417. doi: 10.1016/j.jtbi.2007.06.009. - DOI - PMC - PubMed
    1. Arino O, Kimmel M, Webb GF. Mathematical-modeling of the loss of telomere sequences. J Theor Biol. 1995;177:45–57. doi: 10.1006/jtbi.1995.0223. - DOI - PubMed
    1. Arkus N. A mathematical model of cellular apoptosis and senescence through the dynamics of telomere loss. J Theor Biol. 2005;235:13–32. doi: 10.1016/j.jtbi.2004.12.016. - DOI - PubMed

Publication types

Substances

LinkOut - more resources