. 2013 Jul;110(2):470-80.
doi: 10.1152/jn.00559.2012. Epub 2013 Apr 24.

Thalamic microcircuits: presynaptic dendrites form two feedforward inhibitory pathways in thalamus

Affiliations

Thalamic microcircuits: presynaptic dendrites form two feedforward inhibitory pathways in thalamus

Shane R Crandall et al. J Neurophysiol. 2013 Jul.

Abstract

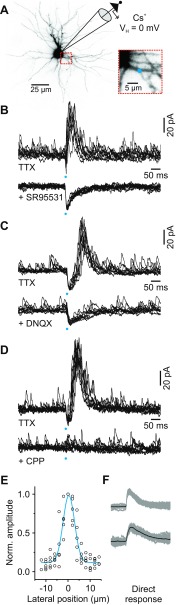
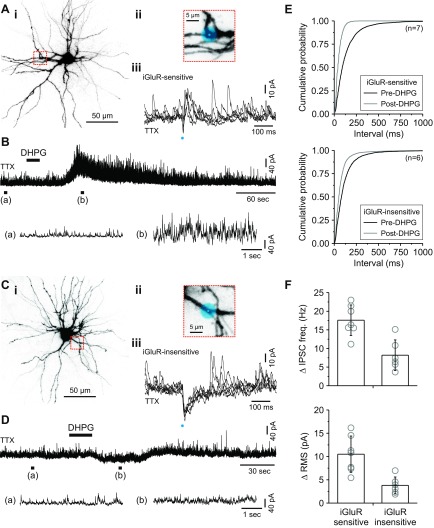
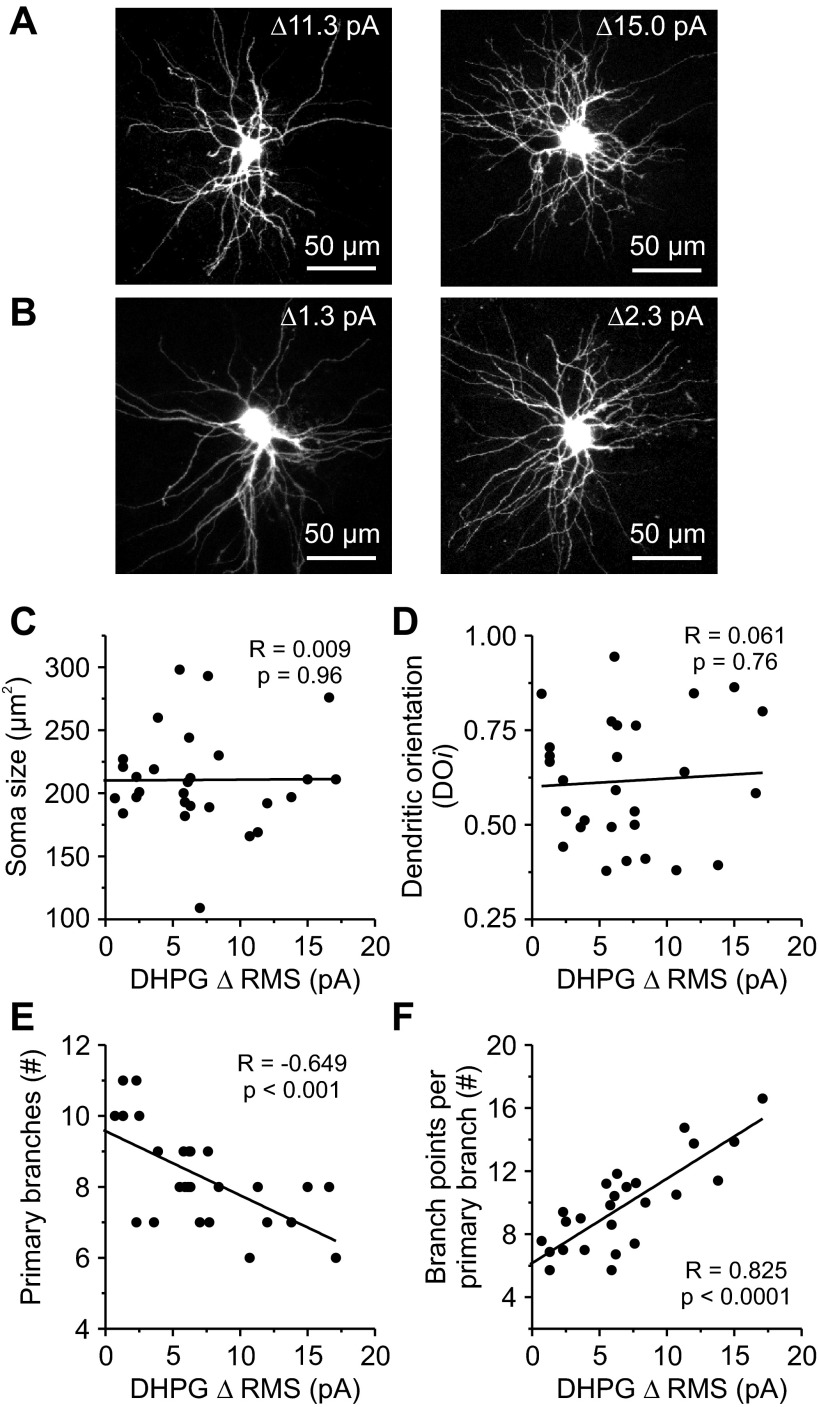
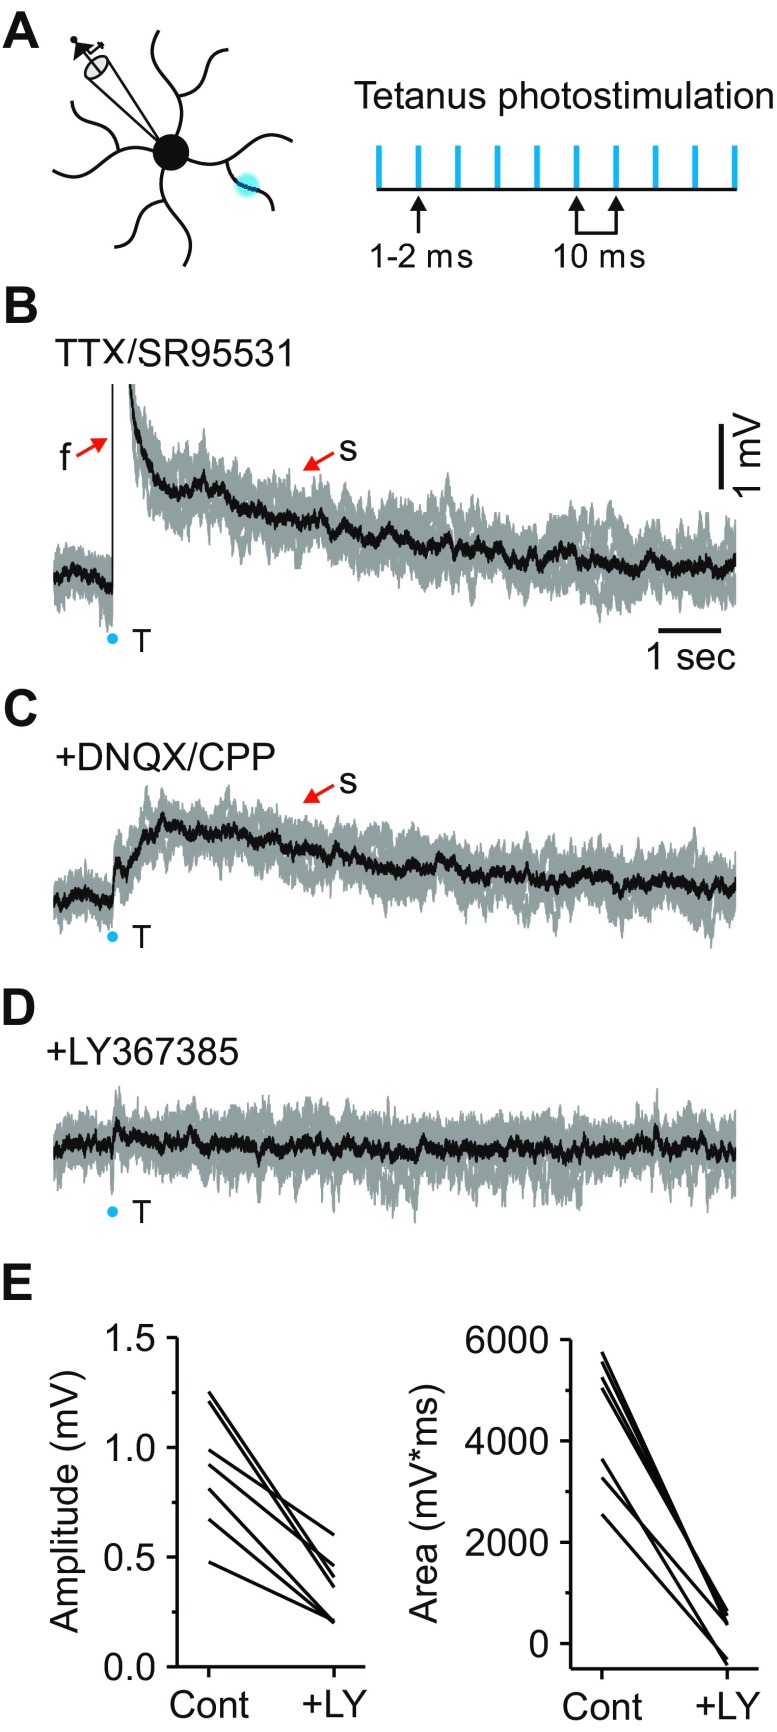
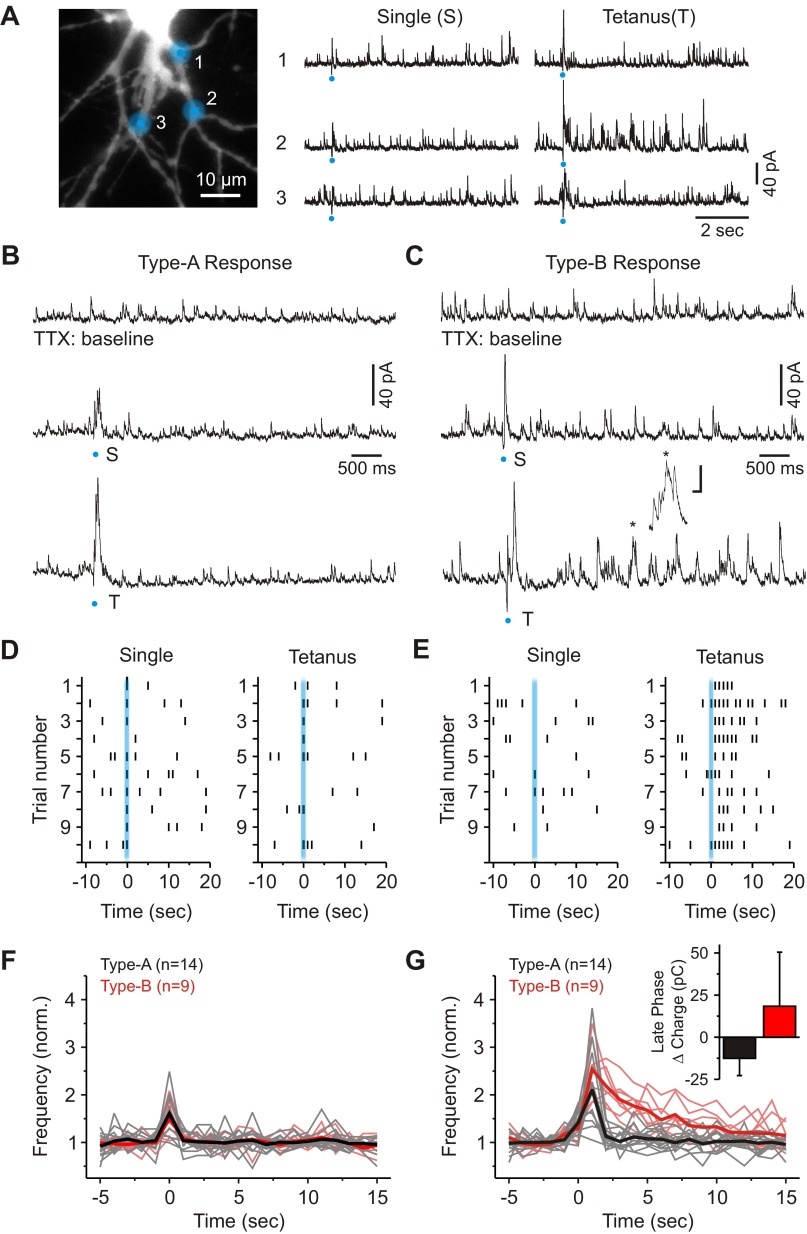
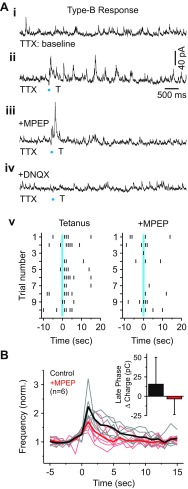
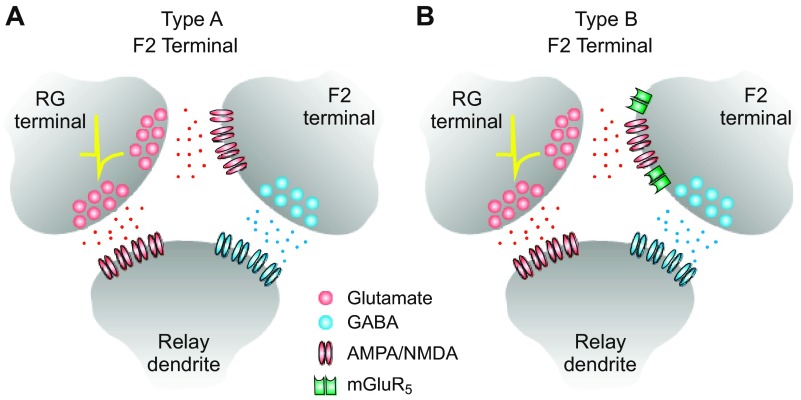
In the visual thalamus, retinal afferents activate both local interneurons and excitatory thalamocortical relay neurons, leading to robust feedforward inhibition that regulates the transmission of sensory information from retina to neocortex. Peculiarly, this feedforward inhibitory pathway is dominated by presynaptic dendrites. Previous work has shown that the output of dendritic terminals of interneurons, also known as F2 terminals, are regulated by both ionotropic and metabotropic glutamate receptors. However, it is unclear whether both classes of glutamate receptors regulate output from the same or distinct dendritic terminals. Here, we used focal glutamate uncaging and whole cell recordings to reveal two types of F2 responses in rat visual thalamus. The first response, which we are calling a Type-A response, was mediated exclusively by ionotropic glutamate receptors (i.e., AMPA and NMDA). In contrast, the second response, which we are calling a Type-B response, was mediated by a combination of ionotropic and type 5 metabotropic glutamate receptors (i.e., mGluR(5)). In addition, we demonstrate that both F2 responses are evoked in the same postsynaptic neurons, which are morphologically distinct from neurons in which no F2 responses are observed. Since photostimulation was relatively focal and small in magnitude, these results suggest distinct F2 terminals, or small clusters of terminals, could be responsible for generating the two inhibitory responses observed. Because of the nature of ionotropic and metabotropic glutamate receptors, we predict the efficacy by which the retina communicates with the thalamus would be strongly regulated by 1) the activity level of a given retinogeniculate axon, and 2) the specific type of F2 terminals activated.

Keywords: dorsal lateral geniculate nucleus; glutamate uncaging; interneuron; presynaptic dendrite; two-photon imaging.


Figures

Fig. 1.
Fig. 1.
Glutamate uncaging evokes ionotropic glutamate receptor (iGluR)-mediated GABA release from the presynaptic dendrites of thalamic interneurons. A: image of rat thalamic relay neuron filled with Alexa Fluor 594 (50 μM). Inhibitory activity in the cell was monitored using a cesium (Cs+) pipette and a command voltage (VH) of 0 mV. Inset: an image showing the dendrite targeted for single-photon glutamate uncaging (blue dot). B, top: in TTX (1 μM), 10 control responses produced by uncaging glutamate at the location shown in A. Bottom: 10 responses obtained from the same location after adding the GABAA receptor antagonist SR-95531 (10 μM). C, top: in TTX (1 μM), 10 control responses from a different relay neuron produced by uncaging glutamate. Bottom: 10 responses obtained from the same location after adding the dl-α-amino-3-hydroxy-5-methylisoxazole-propionic acid (AMPA) receptor antagonist 6,7-dinitroquinoxaline-2,3-dione (DNQX; 20 μM). D, top: in TTX (1 μM), 10 control responses from a different relay neuron produced by uncaging glutamate. Bottom: 10 responses obtained from the same location after adding the N-methyl-d-aspartate (NMDA) receptor antagonist 3-((R)-2-carboxypiperazin-4-yl)-propyl-1-phosphonic acid (CPP; 10 μM). E: plot showing the relationship between the lateral position of the laser beam and the normalized (Norm.) amplitude of the glutamate-evoked response. The blue line is a single Gaussian function fit. F: in TTX (1 μM), direct excitatory responses recorded from 3 different relay neurons. The black line indicates the average of 20 responses (gray traces).
Fig. 2.
Fig. 2.
Both iGluRs and metabotropic glutamate receptors (mGluRs) mediate dendrodendritic activity in the same relay neuron. A, i: image of a thalamic relay neuron. ii, Inset: image of the dendrite targeted for glutamate uncaging (blue dot). iii: In TTX (1 μM), 5 control responses produced by uncaging at the location shown. The glutamate-evoked increase in inhibitory postsynaptic current (IPSC) activity (gluIPSC) indicates that the cell received iGluR-sensitive F2 input. B, top: subsequent application of the group I mGluR agonist (R,S)-3,5-dihydroxyphenylglycine (DHPG; 25 μM) to the same neuron produced a robust increase in F2-mediated IPSC activity. Bottom: expanded traces before (a) and after (b) DHPG application are shown and correspond to the region indicated. C, i: image of a thalamic relay neuron. ii, Inset: image of the dendrite targeted for glutamate uncaging (blue dot). iii: In TTX (1 μM), 5 control responses produced by uncaging at the location shown. The lack of a gluIPSC indicates that the cell did not receive iGluR-sensitive F2 input. D, top: subsequent application of DHPG did not produce a robust change in F2-mediated IPSC activity. Bottom: expanded traces before (a) and after (b) DHPG application are shown and correspond to the region indicated. E: cumulative probability plots showing a significant decrease in the interevent interval with DHPG application for both cell types. F: summary of the peak change in IPSC frequency (freq.) and root mean square (RMS) for both populations after DHPG application.
Fig. 3.
Fig. 3.
The relationship between morphology and F2 innervation for rat thalamic relay neurons. A: images of thalamic relay neurons with “strong” F2 innervation as determined by their DHPG sensitivity (i.e., ΔRMS ≥ 10 pA). B: images of thalamic relay neurons with “weak” F2 innervation as determined by their DHPG sensitivity (i.e., ΔRMS ≤ 5 pA). C–F: group data showing morphological relationships with F2 innervation characterized by a DHPG change in inhibitory activity (i.e., ΔRMS). C: soma size was not correlated with DHPG sensitivity. D: dendritic orientation (DOi) was not correlated with DHPG sensitivity. E: primary branches decreased significantly with DHPG sensitivity. #, Number of. F: branch points per primary branch increased significantly with DHPG sensitivity.
Fig. 4.
Fig. 4.
Tetanic photostimulation reliably activates local mGluRs. A: schematic illustrating how mGluRs were locally activated using tetanic photostimulation protocol (10 pulses, 1–2 ms, 100 Hz). B: in TTX (1 μM) and SR-95531 (10 μM), 5 individual responses produced by tetanic photostimulation (gray traces). The onset of the stimulus is shown by the blue dot, and average response in black. Under these conditions, tetanic photostimulation (T) resulted in both a fast (f; truncated) and slow (s) excitatory potential. C: subsequent application of iGluR blockers (DNQX: 20–40 μM; CPP: 10–20 μM) eliminated the fast potential while leaving the slow potential unaffected. D: the slow potential was attenuated with the addition of the mGluR1 antagonist LY-367385 (100 μM). E: summary of the effects of LY-367385 (LY) on the slow excitatory potential isolated with iGluR blockers (Cont).
Fig. 5.
Fig. 5.
Local glutamate uncaging reveals distinct types of F2 responses in the visual thalamus. A, left: image of a thalamic relay neuron showing the 3 dendritic locations targeted for glutamate uncaging. Right: inhibitory activity evoked from the 3 different locations after delivering a single and tetanic photostimulation. B: characterization of a Type-A response. Top: shown is baseline IPSC activity in the presence of TTX (1 μM). Middle: photostimulation with a single laser pulse produced a fast change in IPSC activity. Bottom: tetanic photostimulation at the same location did not increase the duration of IPSC activity. C: characterization of a Type-B F2 response. Top: shown is baseline IPSC activity in the presence of TTX. Middle: photostimulation with a single laser pulse produced a fast change in IPSC activity. Bottom: tetanic photostimulation at the same location increased IPSC activity over many seconds. A cluster of bursts of IPSCs is identified by the asterisk in the trace. Scale = 20 pA and 50 ms. D: raster plot showing the responses to a single and subsequent train of laser pulses for the cell shown in B. Marks indicate IPSC activity 2 SD above the level of baseline activity. Bins = 1 s. E: raster plot showing the responses to a single and subsequent train of laser pulses for the cell shown in C. F: population data illustrating IPSC frequency over time for a single laser pulse. The thick black and red lines represent averages. Bins = 1 s. G: population data illustrating IPSC frequency over time following tetanic photostimulation. The thick black and red lines represent averages. Bins = 1 s. Inset: a plot illustrating the average change in charge during the late phase of the Type-A and Type-B responses.
Fig. 6.
Fig. 6.
mGluRs regulate prolonged inhibitory output from sites producing the Type-B F2 response. A, i: baseline IPSC activity in TTX (1 μM). ii: Tetanic photostimulation at increased IPSC activity over many seconds. iii: Application of mGluR5 antagonist 2-methyl-6-(phenylethynyl)pyridine hydrochloride (MPEP; 50 μM) attenuated the duration of IPSC activity. iv: Subsequent application of DNQX (20–40 μM) blocked the initial fast change in IPSC activity. v: Raster plot showing the responses to tetanic photostimulation before and after MPEP application. B: population data illustrating IPSC frequency over time for the 2 conditions (1-s bins). The thick black and red lines represent averages. Inset: a plot illustrating the average change in charge during the late phase of the Type-B response before and after MPEP application.
Fig. 7.
Fig. 7.
Schematic diagram of 2 putative types of F2 terminal located in the rat visual thalamus. A: inhibitory output from Type-A F2 terminals is exclusively regulated by AMPA/NMDA (ionotropic) glutamate receptors. B: inhibitory output from Type-B F2 terminals is regulated by both AMPA/NMDA (ionotropic) and mGluR5. RG, retinogeniculate.

Similar articles

Cited by

References

    1. Acuna-Goycolea C, Brenowitz SD, Regehr WG. Active dendritic conductances dynamically regulate GABA release from thalamic interneurons. Neuron 57: 420–431, 2008 - PubMed
    1. Augustinaite S, Yanagawa Y, Heggelund P. Cortical feedback regulation of input to visual cortex: role of intrageniculate interneurons. J Physiol 589: 2963–2977, 2011 - PMC - PubMed
    1. Bickford ME, Wei H, Eisenback MA, Chomsung RD, Slusarczyk AS, Dankowsi AB. Synaptic organization of thalamocortical axon collaterals in the perigeniculate nucleus and dorsal lateral geniculate nucleus. J Comp Neurol 508: 264–285, 2008 - PMC - PubMed
    1. Blitz DM, Regehr WG. Timing and specificity of feed-forward inhibition within the LGN. Neuron 45: 917–928, 2005 - PubMed
    1. Bloomfield SA, Sherman SM. Dendritic current flow in relay cells and interneurons of the cat's lateral geniculate nucleus. Proc Natl Acad Sci USA 86: 3911–3914, 1989 - PMC - PubMed

Publication types

Substances

LinkOut - more resources