. 2013 Jul;9(7):1044-56.
doi: 10.4161/auto.24543. Epub 2013 Apr 9.

Lumenal peroxisomal protein aggregates are removed by concerted fission and autophagy events

Affiliations

Lumenal peroxisomal protein aggregates are removed by concerted fission and autophagy events

Selvambigai Manivannan et al. Autophagy. 2013 Jul.

Abstract

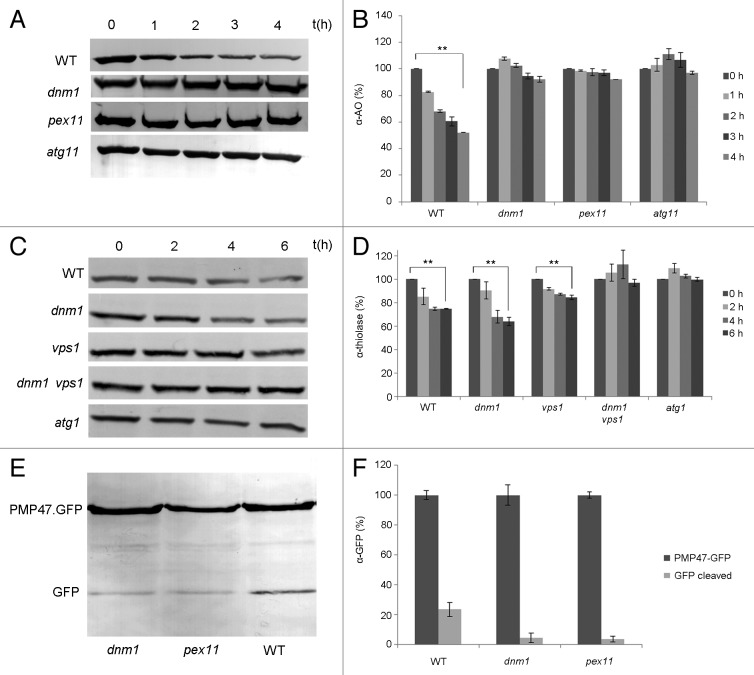
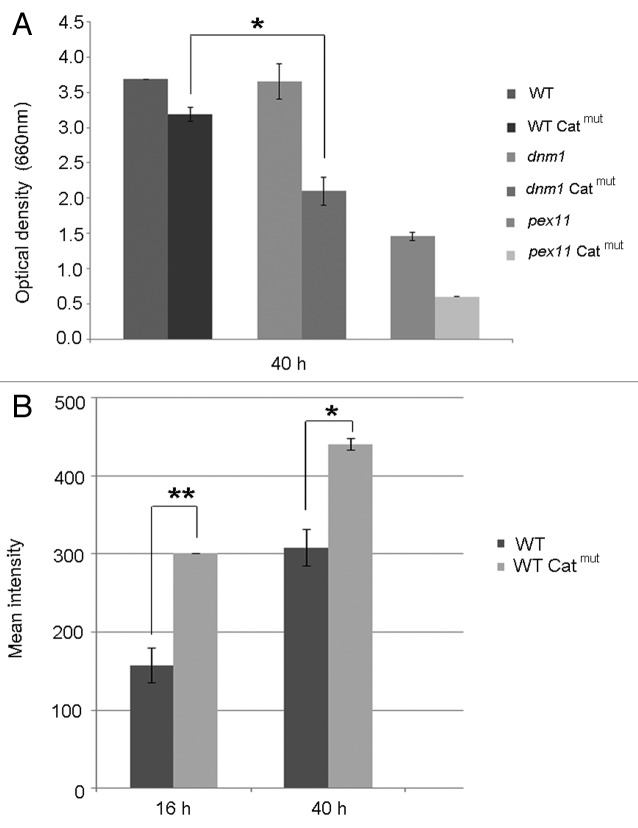
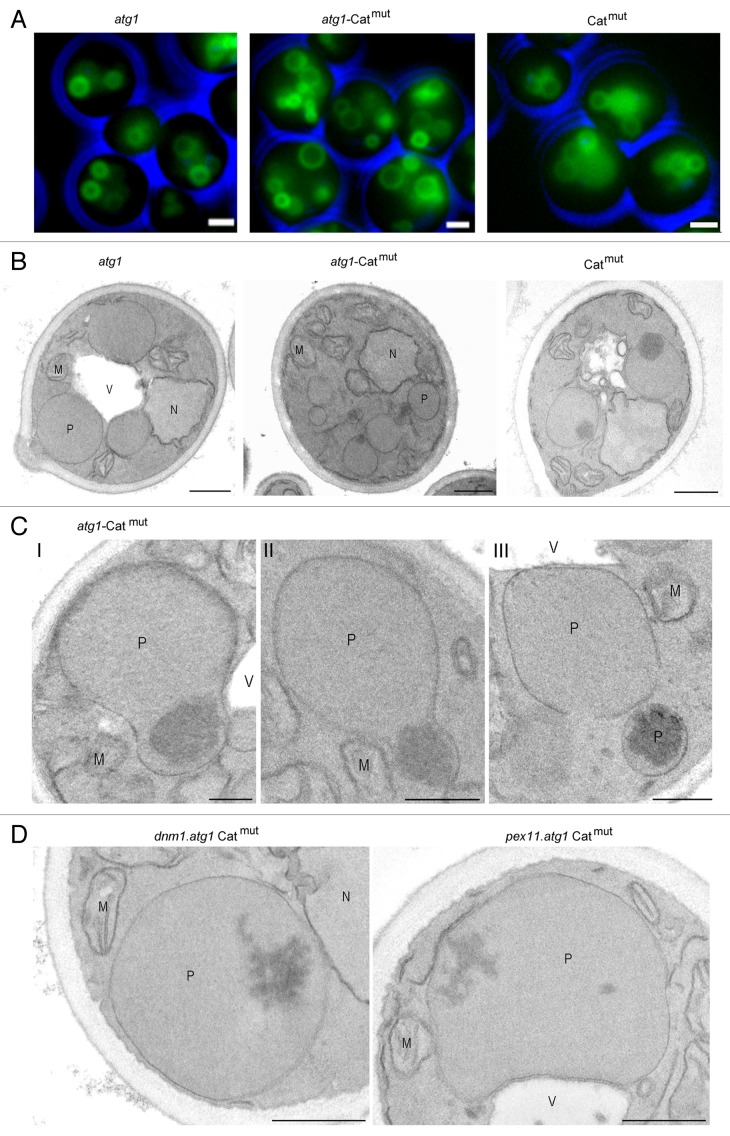
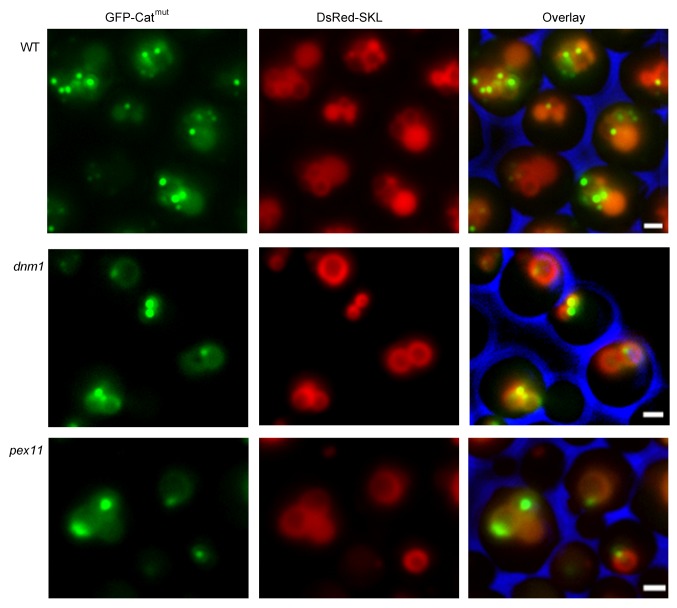
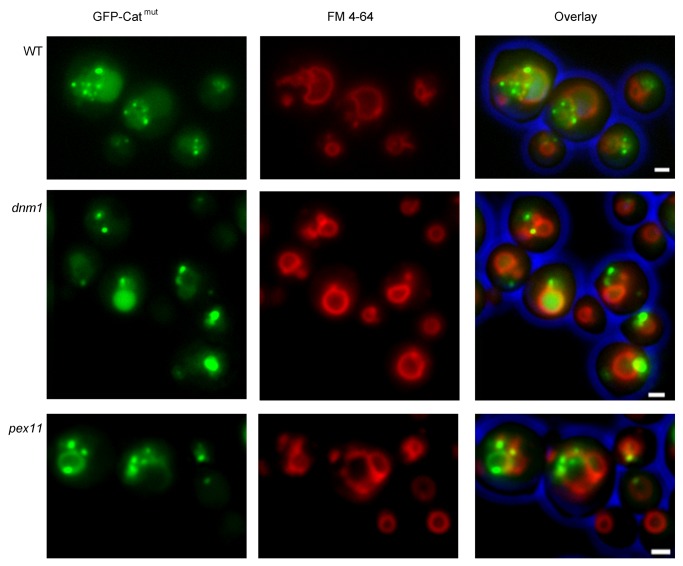
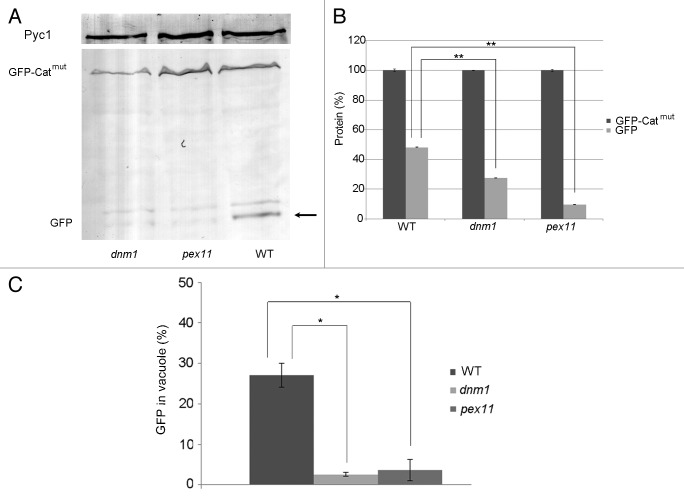
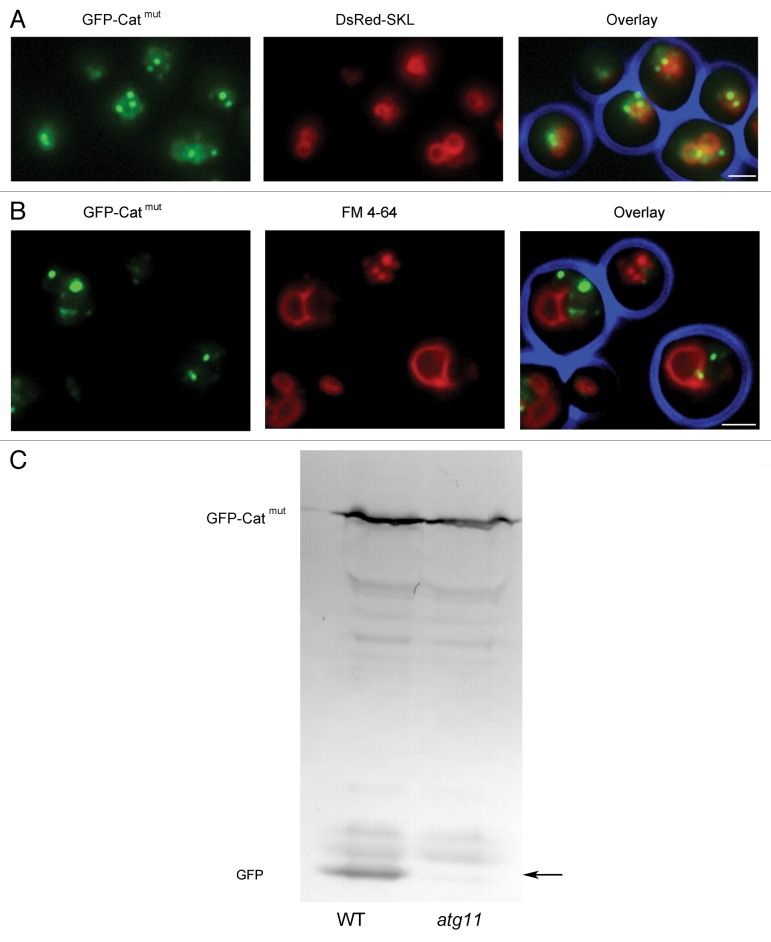
We demonstrated that in the yeast Hansenula polymorpha peroxisome fission and degradation are coupled processes that are important to remove intra-organellar protein aggregates. Protein aggregates were formed in peroxisomes upon synthesis of a mutant catalase variant. We showed that the introduction of these aggregates in the peroxisomal lumen had physiological disadvantages as it affected growth and caused enhanced levels of reactive oxygen species. Formation of the protein aggregates was followed by asymmetric peroxisome fission to separate the aggregate from the mother organelle. Subsequently, these small, protein aggregate-containing organelles were degraded by autophagy. In line with this observation we showed that the degradation of the protein aggregates was strongly reduced in dnm1 and pex11 cells in which peroxisome fission is reduced. Moreover, this process was dependent on Atg1 and Atg11.

Keywords: autophagy; fission; peroxisome; protein aggregate; yeast.


Figures

None
Figure 1. Reduced peroxisome degradation in H. polymorpha and S. cerevisiae fission mutants. (A) Pexophagy was induced by glucose in H. polymorpha cells grown for 20 h on methanol. Equal volumes of cultures were loaded per lane. Western blots decorated with anti-alcohol oxidase (α-AO) antibodies show no significant reduction in AO levels in the peroxisomal fission mutants dnm1 and pex11, similar to the atg11 control, which is blocked in pexophagy, whereas AO levels gradually decreased in the wild-type control as expected. (B) Densitometry quantification of the blots shown in (A). The amount of AO protein present at t = 0 h was set to 100%. The bar represents the standard error of the mean (SEM). (**p < 0.01). (C) Western blot analysis showing thiolase levels of S. cerevisiae cells grown on oleate and subsequently diluted into SD(-N) medium to induce peroxisome degradation. Samples were harvested at different time points, and equal amounts of protein were loaded per lane. There is no significant decrease of thiolase in the dnm1vps1∆ double mutant where the peroxisomal fission is completely blocked. A similar result was obtained for the atg1 control strain. In the wild-type and the single vps1 and dnm1 deletion strains degradation occurred. (D) Quantification of thiolase blots shown in (C). The level of thiolase protein at t = 0 h was set to 100%. Levels were adjusted to the loading control glucose-6-phosphate dehydrogenase (not shown). The bar represents the SEM (**p < 0.01). (E) Constitutive peroxisome degradation is reduced in H. polymorpha fission mutants. Cells were grown on methanol for 16 h. Western blots were prepared using crude extracts and anti-GFP antibodies to detect Pmp47-GFP and GFP degradation products. The data show that the levels of the cleaved fusion protein (lower band) are reduced in pex11 and dnm1 cells, relative to the wild-type control. Equal concentrations of protein were loaded per lane. (F) Quantification of blots shown in (E). The levels of full-length Pmp47-GFP proteins were arbitrarily set to 100%. The levels of cleaved GFP (lower band) are indicated as percentage of the full-length fusion protein. The bar represents the SEM (*p < 0.05; **p < 0.01).
None
Figure 2. The effect of peroxisomal protein aggregates on growth and ROS levels. (A) Final optical densities of wild-type, dnm1 and pex11 cells, producing or not producing Catmut, upon growth on methanol as sole carbon source for 40 h. Cell were extensively precultivated in glucose medium and subsequently shifted to medium containing methanol. Final optical densities are expressed as adsorption at 660 nm. The bar represents the SEM (*p < 0.05). (B) ROS levels in cells at different time points after the shift of glucose-grown cells to methanol medium. The mean intensity was measured by FACS. Catmut cells show an enhanced ROS production relative to wild-type controls. The bar represents the SEM (*p < 0.05; **p < 0.01).
None
Figure 3. Microscopy analysis of H. polymorpha atg1, atg1-Catmut and wild-type-Catmut cells. Cells were grown on glycerol/methanol for 16 h. Peroxisomal membranes are marked by Pmp47-GFP. (A) Relative to the atg1 control, the atg1-Catmut strain contains multiple small peroxisomes, which was not evident in wild-type-Catmut cells. The bar represents 1 µm. The peroxisomal phenotype was confirmed by electron microscopy (B). Note the presence of protein aggregates in many of the organelles in atg1-Catmut cells of which fewer are observed in wild-type-Catmut cells. The bar represents 0.5 µm. (C) Ultrathin sections of KMnO4-fixed atg1-Catmut cells showing different stages of the formation of a small peroxisome containing a protein aggregate. The bar represents 0.2 µm. (D) Electron micrographs, showing details of dnm1.atg1 cells (left panel) and pex11.atg1 cells (right panel) producing Catmut, demonstrating the presence of aggregates in the enlarged peroxisomes in these cells. The bar represents 0.2 µm. P, peroxisomes; M, mitochondria; N, nucleus; V, vacuole.
None
Figure 4. Catalase aggregates are degraded by autophagy. H. polymorpha wild-type and Catmut cells were cultivated on glycerol/methanol for 12 h and subsequently treated with 1 mM PMSF (t = 0). Electron micrographs of KMnO4-fixed Catmut cells [at t = 0 h (B)], [at t = 2 h (D) and t = 4 h (F)] revealed progressive accumulation of autophagic bodies containing peroxisomes with protein aggregates that are not observed in wild-type cells (A, C and E). Immunocytochemical localization of catalase shows that labeling is confined to peroxisomes of wild-type cells (G) and is also abundant in the vacuole of Catmut cells (H). M, mitochondria; N, nucleus; P, peroxisomes; V, vacuole. The bar represents 0.5 µm.
None
Figure 5. Visualization of catalase protein aggregates. H. polymorpha wild-type, dnm1 and pex11 cells, producing DsRed-SKL and GFP-Catmut, were grown on methanol for 16 h. The peroxisomes contained GFP spots in the peroxisomal lumen, which represent the protein aggregates.
None
Figure 6. Visualization of catalase protein aggregates. Identical experiment as shown in Figure 5, using wild-type, dnm1 and pex11 cells, producing GFP-Catmut stained with the vacuolar marker dye FM 4–64. GFP fluorescence was frequently observed in the vacuoles of wild-type cells. GFP fluorescence was also observed in the vacuoles of the dnm1 and pex11 cells, albeit at reduced numbers compared with the wild-type control. The bar represents 1 µm.
None
Figure 7. Autophagic degradation of GFP-Catmut is reduced in pex11 and dnm1 cells. (A) Western blot analysis using crude extracts of cells described in Figure 5, decorated with anti-GFP antibodies. All strains contain both the full-length GFP-Catmut protein together with GFP (arrow), due to cleavage of the fusion protein. Pyruvate carboxylase (Pyc1) was used as a loading control. (B) Quantification of the levels of GFP-Catmut and GFP protein of the blots shown in (A). The level of full-length GFP-Catmut is set to 100%. The bar represents the SEM (**p < 0.01). (C) Quantification of GFP fluorescence in the vacuole. The percentage of cells containing GFP fluorescence in the vacuole was calculated for wild-type, dnm1 and pex11 cells containing PAOXGFP-Catmut. Per strain 2 samples of each 100 cells were counted The bar represents the SEM (*p < 0.05).
None
Figure 8. Autophagic degradation of GFP-Catmut is reduced in atg11 cells. (A) In H. polymorpha atg11 cells producing DsRed-SKL and GFP-Catmut and grown on methanol for 16 h, most GFP-Catmut spots colocalize with the peroxisomal matrix marker DsRed-SKL. Some of the green spots do not colocalize with DsRed-SKL. Most likely this is the result of the asymmetric peroxisome fission process, resulting in the formation of small aggregate-containing peroxisomes that contain no or very little DsRed-SKL. (B) Vacuolar staining of atg11 GFP-Catmut cells with FM 4–64 dye. GFP fluorescence in the vacuoles is reduced in atg11 cells relative to the wild-type control (see Fig. 6). The bar represents 1 µm. (C) Western blots decorated with anti-GFP antibodies fail to demonstrate the GFP cleavage product (arrow) in atg11 cells producing GFP-Catmut.

Similar articles

Cited by

References

    1. Lozy F, Karantza V. Autophagy and cancer cell metabolism. Semin Cell Dev Biol. 2012;23:395–401. doi: 10.1016/j.semcdb.2012.01.005. - DOI - PMC - PubMed
    1. Todde V, Veenhuis M, van der Klei IJ. Autophagy: principles and significance in health and disease. Biochim Biophys Acta. 2009;1792:3–13. doi: 10.1016/j.bbadis.2008.10.016. - DOI - PubMed
    1. Cuervo AM. Autophagy: in sickness and in health. Trends Cell Biol. 2004;14:70–7. doi: 10.1016/j.tcb.2003.12.002. - DOI - PubMed
    1. Harris H, Rubinsztein DC. Control of autophagy as a therapy for neurodegenerative disease. Nat Rev Neurol. 2012;8:108–17. doi: 10.1038/nrneurol.2011.200. - DOI - PubMed
    1. Hartl FU, Bracher A, Hayer-Hartl M. Molecular chaperones in protein folding and proteostasis. Nature. 2011;475:324–32. doi: 10.1038/nature10317. - DOI - PubMed

LinkOut - more resources