Clinical Trial
. 2013 Jun 7;288(23):16629-16644.
doi: 10.1074/jbc.M113.469726. Epub 2013 Apr 23.

The in vivo TRPV6 protein starts at a non-AUG triplet, decoded as methionine, upstream of canonical initiation at AUG

Affiliations
Clinical Trial

The in vivo TRPV6 protein starts at a non-AUG triplet, decoded as methionine, upstream of canonical initiation at AUG

Claudia Fecher-Trost et al. J Biol Chem. .

Abstract

TRPV6 channels function as epithelial Ca(2+) entry pathways in the epididymis, prostate, and placenta. However, the identity of the endogenous TRPV6 protein relies on predicted gene coding regions and is only known to a certain level of approximation. We show that in vivo the TRPV6 protein has an extended N terminus. Translation initiates at a non-AUG codon, at ACG, which is decoded by methionine and which is upstream of the annotated AUG, which is not used for initiation. The in vitro properties of channels formed by the extended full-length TRPV6 proteins and the so-far annotated and smaller TRPV6 are similar, but the extended N terminus increases trafficking to the plasma membrane and represents an additional scaffold for channel assembly. The increased translation of the smaller TRPV6 cDNA version may overestimate the in vivo situation where translation efficiency may represent an additional mechanism to tightly control the TRPV6-mediated Ca(2+) entry to prevent deleterious Ca(2+) overload.

Keywords: Antibodies; Calcium Channels; Mass Spectrometry (MS); TRP Channels; TRPV6; Translation; Translation Initiation at Non-AUG.


Figures
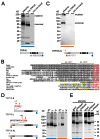
FIGURE 1.
FIGURE 1.
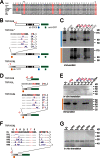
Expression of the TRPV6 protein in human placenta. A, an immunoblot is shown. The TRPV6 protein (∼80 kDa) enriched from human placenta (left lane) by antibody-based affinity purification and after expression of the TRPV6 cDNA in COS cells (middle lane, 5 μl of lysate) was detected by Ab 429 (blue square). Right lane, lysates of non-transfected COS cells are shown. The bar indicates the aa sequence of the annotated TRPV6 protein with the six predicted transmembrane domains in black and the sequence recognized by Ab 20C6 and Ab 429 (blue square). B, shown is MUSCLE multiple sequence alignment of the translated 5′-UTR of TRPV6 as available for the organisms indicated (for accession numbers, see Table 1). Identical aa residues (compared with the human sequence) are shaded; annotated N termini with the first Met+1 are in red; *, stop codon in frame; −, gap; epitopes for Ab 1271 (orange bar) and Ab 1272 (open orange bar). C, the immunoblot is as in A but incubated with the Ab 1271 (orange square) directed against a translated sequence of the annotated 5′-UTR of human TRPV6 (GenBankTM accession number NM_018646.3). D, shown is expression of the TRPV6 cDNA constructs “small” (TRPV6-S, starting with the first AUG in frame encoding the first methionine, +1), “large” (TRPV6-L, forced to start with threonine, −40, by the 5′ inserted KOZAK sequence, indicated), and “very large” (TRPV6-XL, containing the complete 5′-UTR of the human TRPV6 gene) in COS cells and detected by Ab 20C6 (blue, left panel) and 1271 (orange, right panel). E, TRPV6-XL protein enriched by antibody-based affinity purification from human placenta is glycosylated. Affinity-purified TRPV6 (lane 1, input) and after 1 h of incubation at 37 °C in the presence (lane 2) and absence (lane 3) of N-glycosidase F (PNGase) are shown. Western blots and (bottom) region of TRPV6 recognized by antibody 20C6 (blue) and antibody 1271 (orange) shown are.
FIGURE 2.
FIGURE 2.
Immunofluorescent staining of TRPV6 in human placenta tissue. Staining of trophoblast cells (arrows) of placenta villus trees by abs 1271 (A), 1272 (B), and 20C6 (C) is shown. D and E are negative controls: photographs of placenta sections in the absence of primary antibody 20C6 (D) and 1271 and 1272 (E).
FIGURE 3.
FIGURE 3.
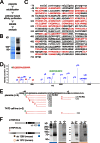
Identification of translation initiation of the human TRPV6 protein. A, shown is alignment of 5′-UTR TRPV6 sequences including the AUG triplet encoding the first methionine (red, +1) of the human protein. Red, putative initiation sites; underlined, STOP-codon in frame (GenBankTM accession numbers as in Table 1). B and C, The S, XL, and L hTRPV6 cDNAs were expressed in HEK293 cells; protein lysates of these cells were applied to SDS-PAGE electrophoresis, blotted, and incubated with Ab 20C6 (C, blue, upper panel) and Ab 1271 (C, orange, lower panel). The TRPV6-L* constructs contain an inserted nine-nucleotide 5′ sequence in front of the ACG codon (in red, for threonine (T)) very similar to the consensus sequence of the initiation of translation in vertebrates. Introduced mutations into the ACG codon (coding for threonine at position −40) and one mutation altering the 3′ codon (GGA) are indicated; the encoded aa are in parentheses. D and E, the cDNAs encoding the 46-aa N-terminal TRPV6 protein without (S) and with the complete 5′-UTR (XL) or the L sequence were fused with the GFP-cDNA. The TRPV6-L construct contains the 5′ inserted KOZAK sequence in front of the ACG codon (in red, for threonine (T). After in vitro transcription/translation, 35S-labeled proteins were run on SDS-PAGE, which was then exposed to an x-ray film (E, upper panel) or blotted and incubated with Ab 1271 (E, lower panel). F and G, in vitro transcription/translation of the TRPV6-XL-GFP fusion construct carrying the indicated mutations in the potential upstream initiation codon AGG (red, for arginine (R)) and in the adjacent 3′-AGA codon with the resulting aa sequences in parentheses.
FIGURE 4.
FIGURE 4.
Identification of the TRPV6 protein from human placenta. A, workflow of TRPV6 affinity purification from placenta microsomal membranes and mass spectrometric analysis is shown. B, total eluates were separated on denaturing gels, stained with Coomassie (left lane), in-gel-trypsinized, and analyzed by nano-LC MS/MS spectrometry or blotted and incubated with antibody 429 recognizing the C terminus (right lane). C, shown is the predicted primary sequence of the human TRPV6 including the translated 5′-UTR (capital letter, experimental evidence; lowercase, no evidence) with the predicted Thr−40 replaced by the identified methionine (in green). Amino acids of all other peptides identified with nano-LC MS/MS are in red (sequence coverage 17.5–38.3; summary of all peptides are in supplemental Table 1), not identified aa are colored in black, and putative transmembrane segments are underlined. D, shown is the MS/MS fragmentation spectrum of the most upstream N-terminal TRPV6-derived peptide shown in C. E, below the predicted amino acid sequence (in black) the identified MS/MS sequences of the most upstream N-terminal TRPV6-derived peptides obtained from human placenta and from the T47D breast cancer cell line (n, number of independent purifications; number of MS/MS spectra in brackets) are shown. F, the translation start of murine TRPV6 is located upstream of the canonical AUG. Mouse TRPV6 cDNA expression constructs small (mTRPV6-S, starting with the first ATG in frame encoding the first methionine and devoid of the complete 5′-UTR) and very large (mTRPV6-XL, containing the complete 5′-UTR of the mouse TRPV6 gene) are shown. Western blot of protein lysates from transfected COS cells incubated in the presence of Ab 429 (blue, left panel), Ab 1272 (orange), and Ab 1286 (brown) is shown. The mTRPV6-XL is recognized by Ab 429, Ab 1286 (raised against the predicted mouse sequence), and Ab 1272 (raised against the predicted human sequence, which is 85% identical to the corresponding mouse sequence).
FIGURE 5.
FIGURE 5.
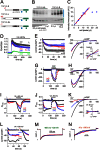
Functional properties of TRPV6-S, TRPV6-L, and TRPV6-XL. A, shown are the small (S), large (L), and very large (XL) TRPV6 cDNAs (open bar with six transmembrane domains indicated in black) as parts of bicistronic IRES-GFP (green bar) vectors expressed in HEK 293 cells. Positions of Ab 20C6 (blue) and anti-GFP (green) are indicated. B, shown is an immunoblot. Different amounts (gray) of protein lysates from green fluorescent HEK 293 cells expressing TRPV6-XL (left) and TRPV6-S (right) were separated by gel electrophoresis, blotted, and incubated with Ab 20C6 (blue) or the antibody for GFP (green, as loading control). C, the intensity of the immunostain for GFP (in A.U.) is plotted against 2.5, 5, 8, and 12 μl of lysates from cells transfected with TRPV6-S-IRES-GFP cDNA (red) and 5, 10, 15, 20, and 25 μl of lysates from cells transfected with TRPV6-XL-IRES-GFP cDNA (blue). The same amount of GFP per μl is detectable after transfection of cells with either cDNA construct. At higher amounts of lysate applied (20 and 25 μl), the intensity saturates. The estimation of the amount of expressed TRPV6-S and TRPV6-XL is based on the amount of GFP calculated only for the linear part of this plot. A representative experiment from three experiments is shown. D, cells from the same transfection as in B were loaded with Fura-2-AM and kept in nominally Ca2+-free bath solution. Ca2+ influx was challenged by adding 2.5 mm Ca2+ to the bath solution, and cytosolic Ca2+ concentration, represented by the Fura-2 fluorescence ratio (F340/F380), was measured versus time. TRPV6-S (red), TRPV6-L (black), TRPV6-XL (blue), and non-transfected HEK 293 cells (green) are shown. Data represent the means ± S.E. with x averaged experiments including n measured cells (x/n). E–N, reducing intracellular Ca2+ induces Ca2+ inward currents in TRPV6-expressing HEK 293 cells. E, shown is net development of low intracellular Ca2+-induced inward and outward currents at −80 and +80 mV, respectively, plotted versus time. F, shown are the corresponding current-voltage relationships (IVs) at maximum currents in E and the inset directly after establishing whole cell configuration (basic current at break-in). Data in E represent the means ± S.E. with n averaged experiments. G and H, in the absence of extracellular divalent cations, the S, L, and XL variants of TRPV6 become permeable to monovalent cations. G, shown is net development of low intracellular Ca2+-induced inward and outward currents at −80 and +80 mV, respectively, plotted versus time. At the indicated time (black bar) divalent-free (DVF) saline was transiently applied, leading to a huge increase of the inward current. H, corresponding current-voltage relationships right before application of divalent-free saline (120 s) and at maximum currents during divalent-free application (180 s) in G. I—N, shown is voltage dependence of the small, large, and very large variant of TRPV6. I and J, shown is net development of low intracellular Ca2+-induced inward and outward currents at −80 and +80 mV, respectively, plotted versus time and normalized to the current size at −80 mV at 120 s (I/I120s). At the indicated times (black bar) the holding potential (Vh) was transiently changed from 0 to +60 mV (I) and −60 mV (J), leading to a significant increase and a complete block of the inward current, respectively. K, shown are the corresponding IVs of the maximal current at Vh 60 mV and minimal current at Vh −60 mV (inset). L, shown is net development of low intracellular Ca2+-induced inward and outward currents at −80 and +80 mV, respectively, plotted versus time. At the indicated times a 400-ms (green) and a 10-s voltage step (orange) to −100 mV were applied. M and N, normalized changes of the inward current at the 400 ms (M) and 10 s (N) voltage step to −100 mV show the “fast” and “slow” hyperpolarization-dependent inactivation, respectively. Data in F–N represent the means with n averaged experiments (for current-voltage relationships, see the corresponding traces) but without S.E. for a better differentiation of the traces. pA/pF, picoamperes/picofarads.
FIGURE 6.
FIGURE 6.
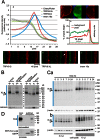
A, shown is distribution of TRPV6-XL and TRPV6-S fused to GFP perpendicular to the cell membrane. Aa, shown is cumulative distribution of TRPV6-XL (green; 48 membrane segments from 32 cells), TRPV6-S (dark magenta; 38 segments from 22 cells), and tmem 16a (cyan; 95 segments from 32 cells) perpendicular to the membrane (means ± 95% confidence intervals). tmem 16a or anoctamin 1 is a Ca2+-activated chloride channel protein used here as an independent control. The peaks of the CherryPicker fluorescence (red) of all membrane segments were taken as a marker for the cell membrane and were used to align individual samples (red fluorescence in A, b, d, f, g, and h). All curves are weighted means of the z- and least squares-transformed fluorescence intensities with the number of scan lines in each sample as a weight. Ab, using dedicated software, starting as well as end points of appropriate membrane samples were defined, and the image was rotated so that the selected membrane segment was angled vertically (A, f, g, and h). A, c and d, shown are the vertically aligned membrane segments were linearized by cross-correlation of individual scan lines with the center scan line of the membrane segment. To minimize the influence of hot spots of fluorescence on the linearization (arrow mark in Ag), the membrane was traced manually with a digitizing tablet, the manual trace was smoothed by a moving average filter, and a region of interest was defined to the left and right of the cell membrane, which entered the cross correlation algorithm (39). After linearization, fluorescence intensities were added column-wise and displayed as a curve. The peak of the red fluorescence as well as the background value for each fluorescence channel was determined automatically by the software with manual correction if required. A, b, c, d, and e, samples were derived from one membrane specimen. A, f and g, four typical samples each of membrane segments from cells transfected with cDNAs for TRPV6-S-GFP or TRPV6-XL-GFP, respectively (green fluorescence) are shown. Each sample has a height of 126 scan lines (21). Two membrane samples from cells transfected with tmem 16a-GFP cDNA (green fluorescence) served as the control. B, immunoblots of surface-expressed TRPV6-XL (XL) and TRPV6-S (S) cDNAs were detected by Ab 20C6 (blue). The endoplasmic reticulum protein calnexin was used as the control. C, shown is a comparison of protein stability of TRPV6-S and TRPV6-XL at the indicated time points after cycloheximide treatment. To allow adequate densitometric analysis of the intensity of the antibody stain, only one-third of the amount of protein lysate from TRPV6-S-transfected cells was applied per lane compared with protein lysate from TRPV6-XL-transfected cells. Shown is an immunoblot with Ab 26B3 for TRPV6; β-actin was used as an independent control. TRPV6 proteins were fused to GFP (Ca) and non-fused TRPV6 (Cb). D, HEK 293 cell lysate of TRPV6-XL (input XL) was incubated with either the GST or GST-TRPV6-XL N terminus bound to glutathione-agarose. Bound proteins were separated on SDS-PAGE and blotted, and the membrane was stained with Ponceau red (lower panel, input control of GST and GST fusion protein) and then incubated with antibody 429 (upper panel, immunoblot), (n = 2).
FIGURE 7.
FIGURE 7.
A, shown is MUSCLE multiple sequence alignment of the translated 5′-UTR of TRPV5 as available from the Ensembl genome browser. Identical aa residues are shaded; annotated N termini with the first methionine as +1 are in red; * (yellow), stop codon in frame; -, gap. B, shown is alignment of the ankyrin repeat domain of TRPV6 including the ankyrin repeat consensus (17), part of the TRPV6-XL sequence, and the six TRPV6 ankyrin repeats. Shaded, sequence identity with the consensus; red, sequence identity only within the TRPV6 sequences.

Similar articles

Cited by

References

    1. Wu L. J., Sweet T. B., Clapham D. E. (2010) International Union of Basic and Clinical Pharmacology. LXXVI. Current progress in the mammalian TRP ion channel family. Pharmacol. Rev. 62, 381–404 - PMC - PubMed
    1. Peng J. B., Chen X. Z., Berger U. V., Vassilev P. M., Tsukaguchi H., Brown E. M., Hediger M. A. (1999) Molecular cloning and characterization of a channel-like transporter mediating intestinal calcium absorption. J. Biol. Chem. 274, 22739–22746 - PubMed
    1. Peng J. B., Chen X. Z., Berger U. V., Weremowicz S., Morton C. C., Vassilev P. M., Brown E. M., Hediger M. A. (2000) Human calcium transport protein CaT1. Biochem. Biophys. Res. Commun. 278, 326–332 - PubMed
    1. Wissenbach U., Niemeyer B. A., Fixemer T., Schneidewind A., Trost C., Cavalie A., Reus K., Meese E., Bonkhoff H., Flockerzi V. (2001) Expression of CaT-like, a novel calcium-selective channel, correlates with the malignancy of prostate cancer. J. Biol. Chem. 276, 19461–19468 - PubMed
    1. Weissgerber P., Kriebs U., Tsvilovskyy V., Olausson J., Kretz O., Stoerger C., Mannebach S., Wissenbach U., Vennekens R., Middendorff R., Flockerzi V., Freichel M. (2012) Excision of Trpv6 gene leads to severe defects in epididymal Ca2+ absorption and male fertility much like single D541A pore mutation. J. Biol. Chem. 287, 17930–17941 - PMC - PubMed

Publication types