. 2013;11(4):e1001538.
doi: 10.1371/journal.pbio.1001538. Epub 2013 Apr 16.

Rnf165/Ark2C enhances BMP-Smad signaling to mediate motor axon extension

Affiliations

Rnf165/Ark2C enhances BMP-Smad signaling to mediate motor axon extension

Claire E Kelly et al. PLoS Biol. 2013.

Abstract

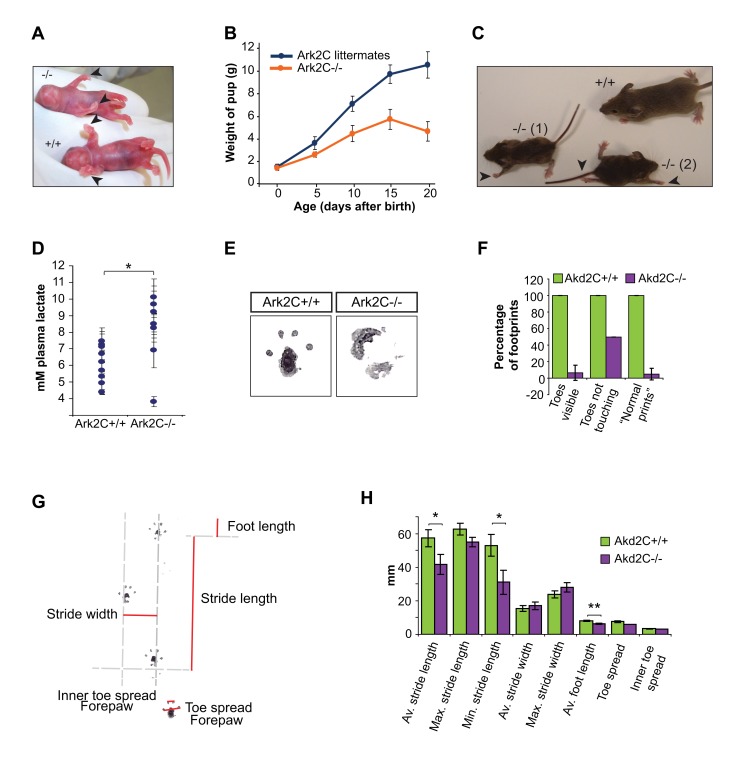
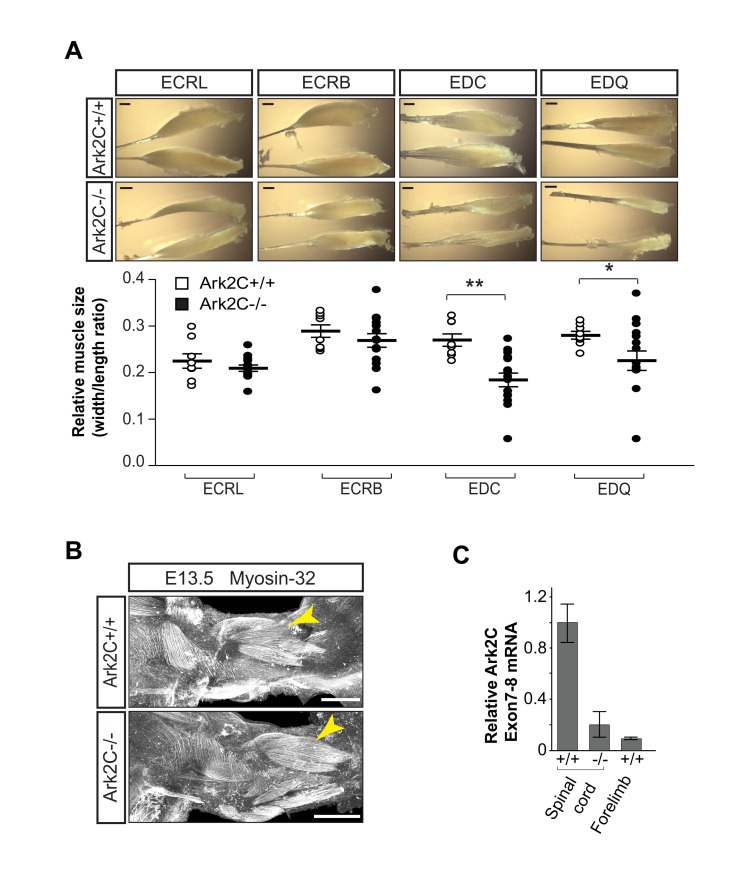
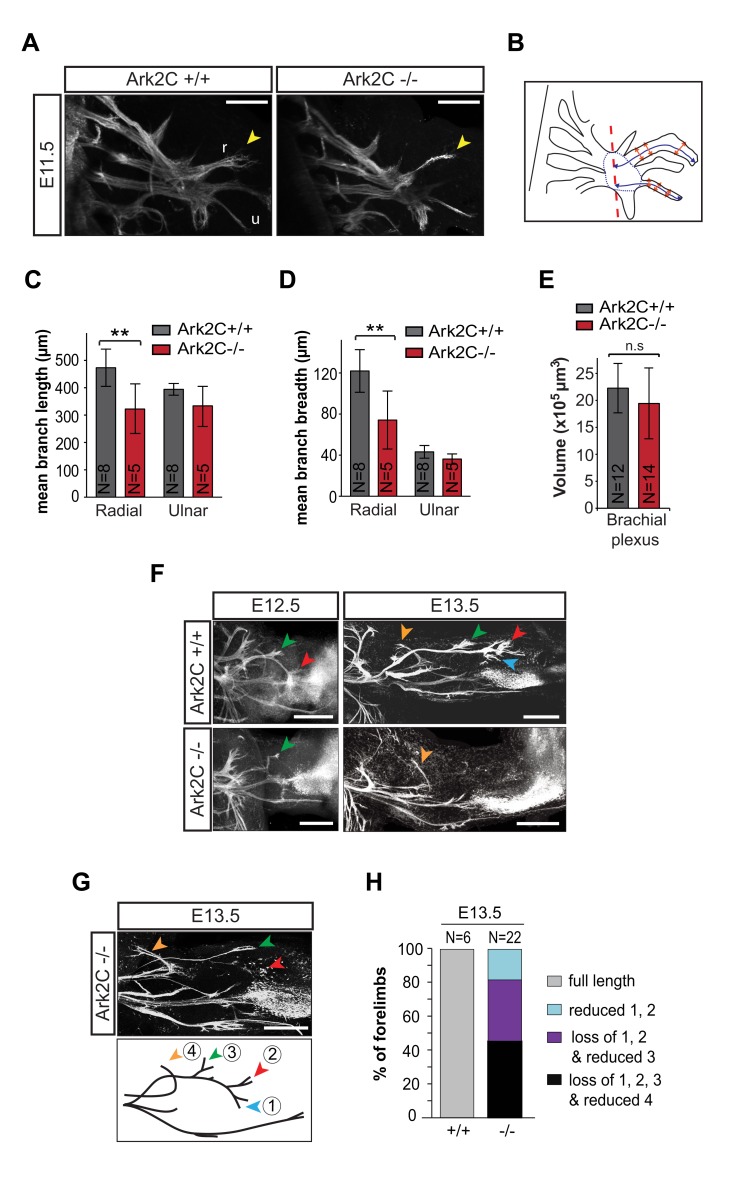
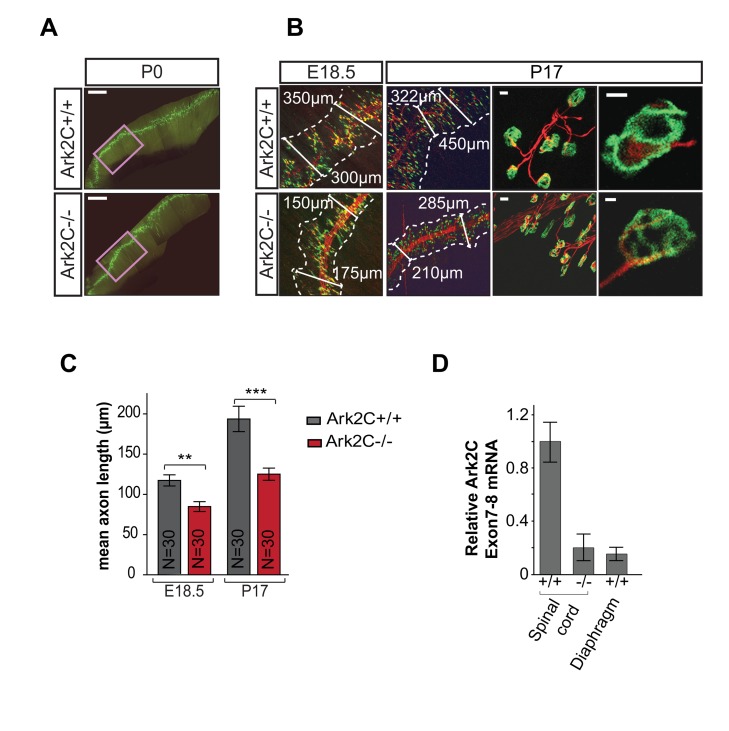
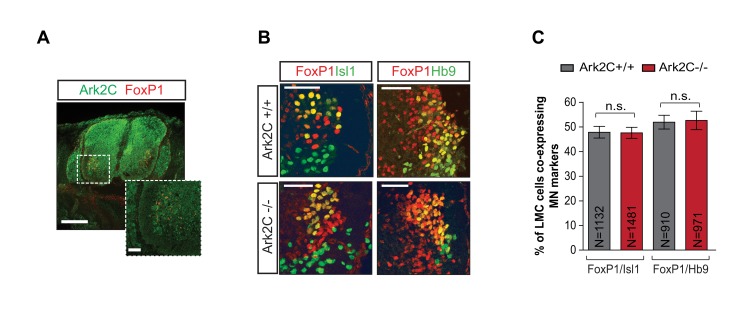
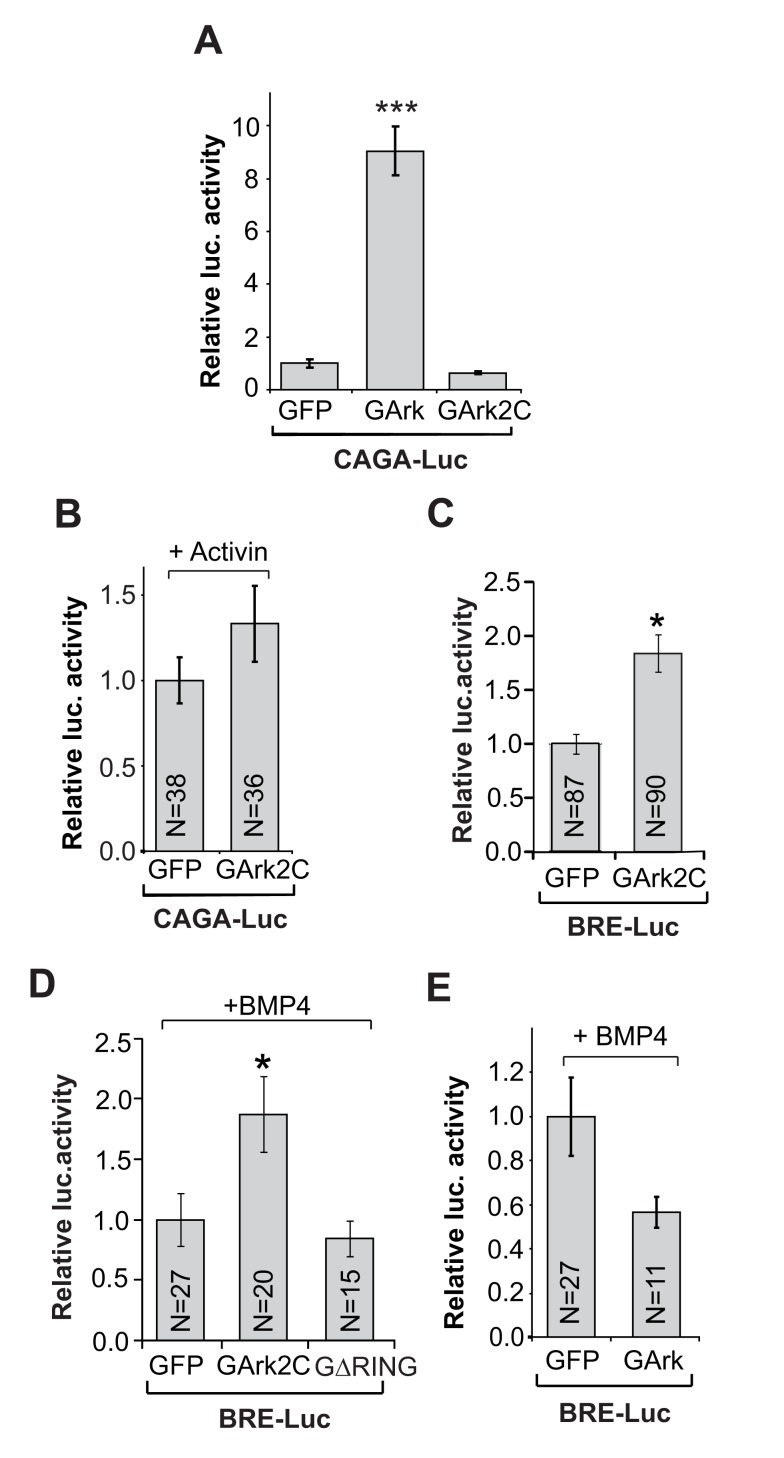
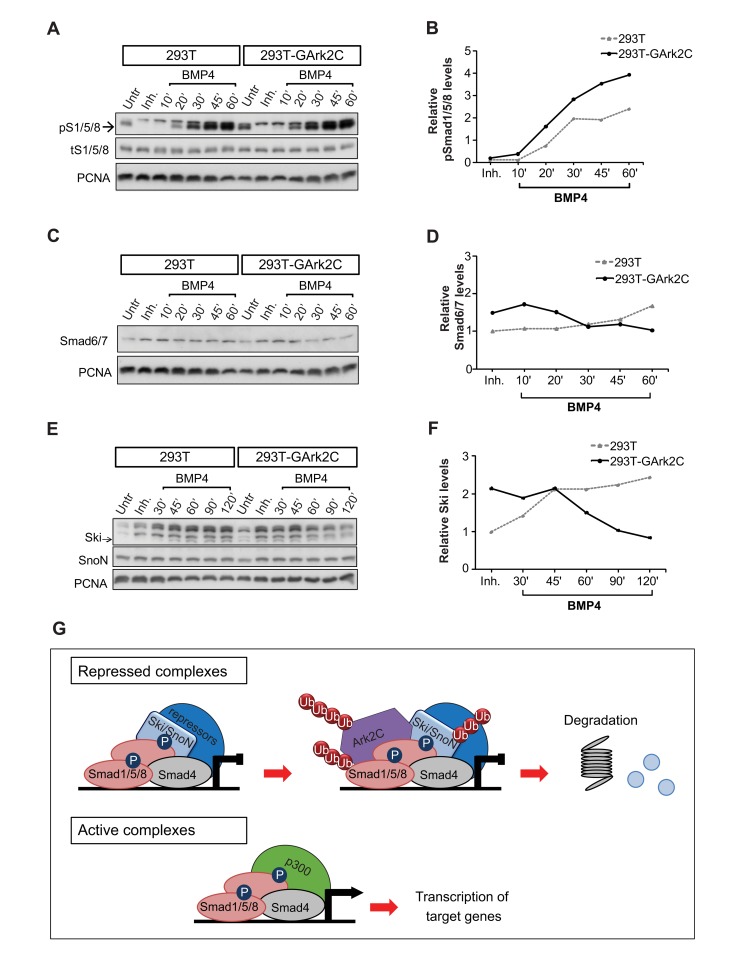
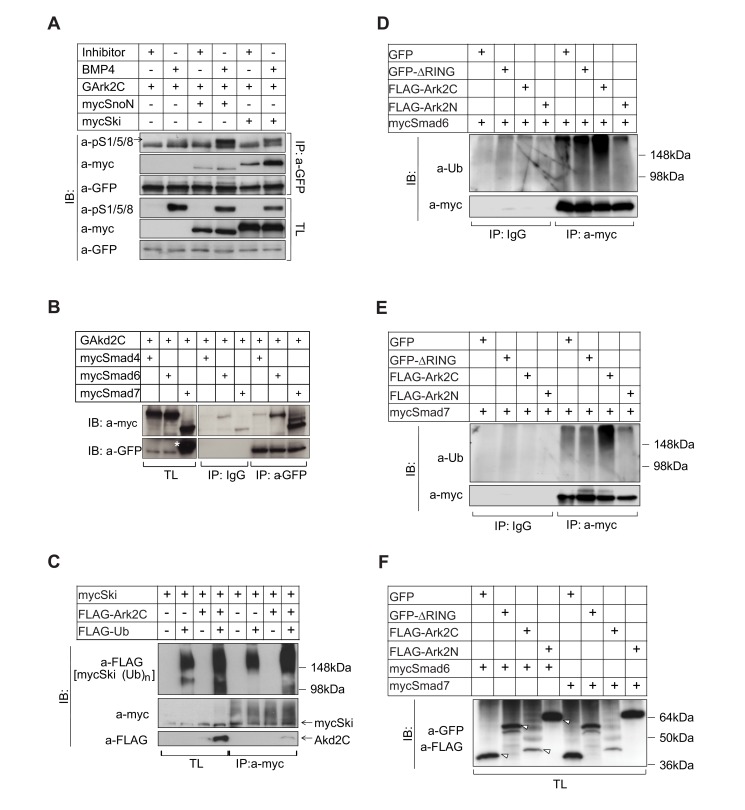
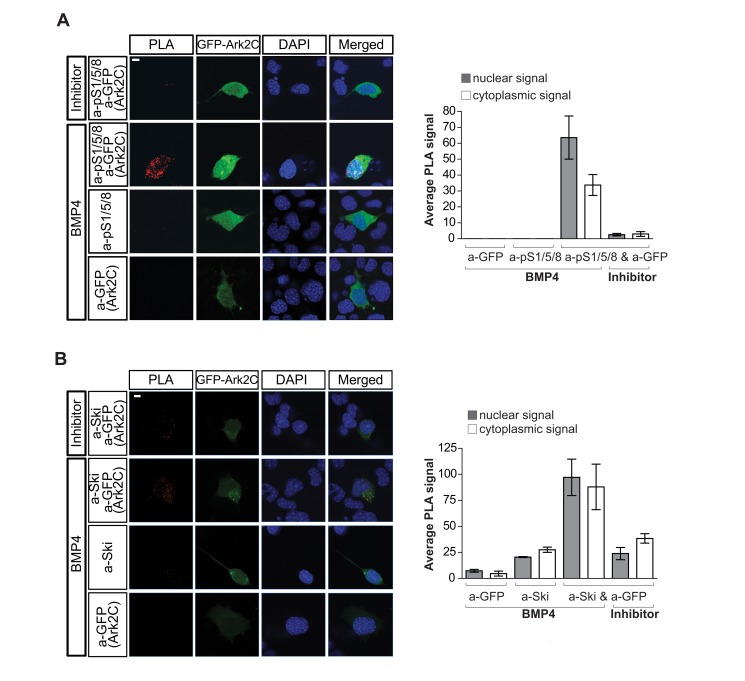
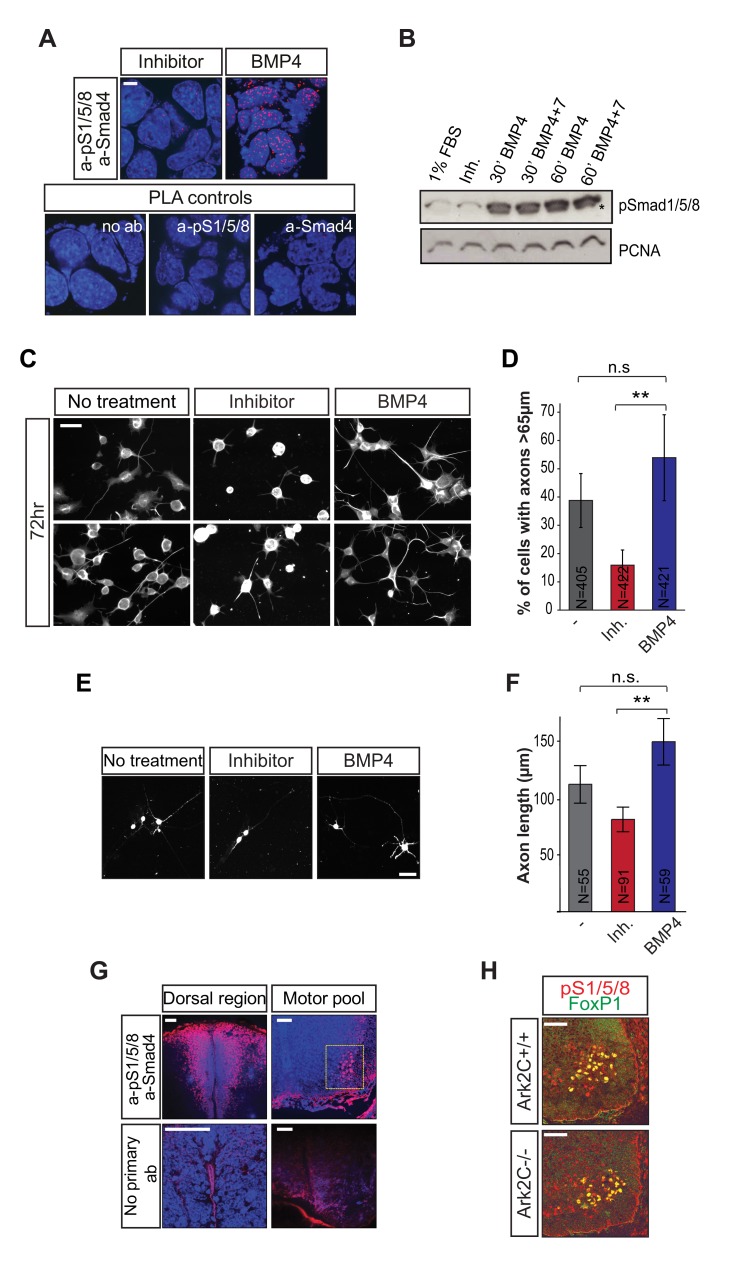
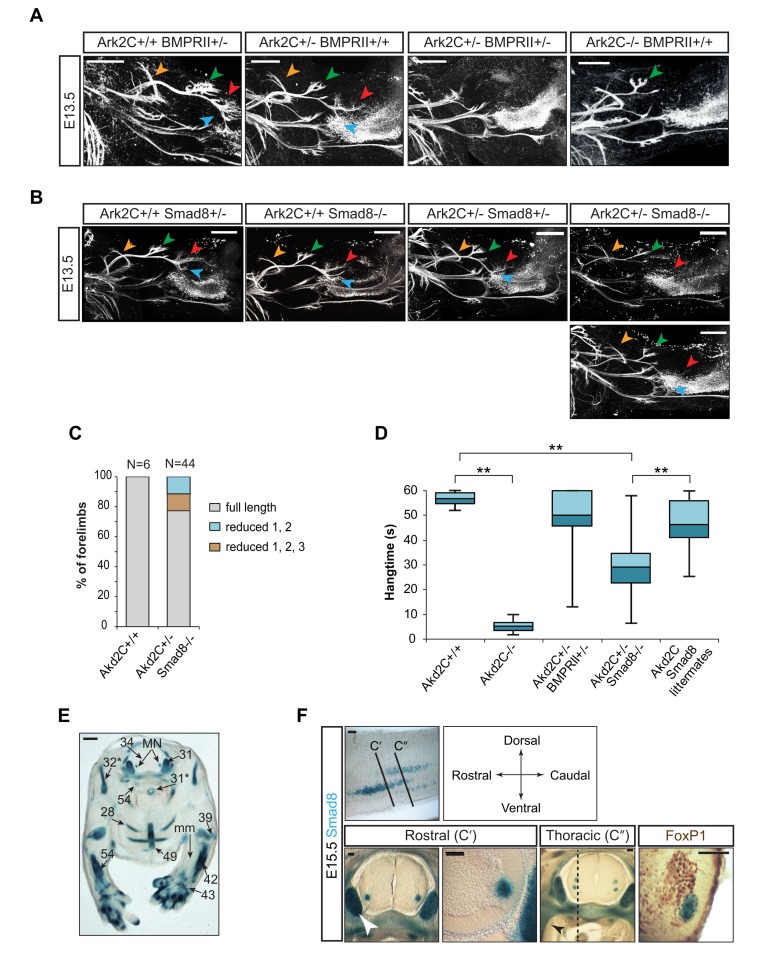
Little is known about extrinsic signals required for the advancement of motor neuron (MN) axons, which extend over long distances in the periphery to form precise connections with target muscles. Here we present that Rnf165 (Arkadia-like; Arkadia2; Ark2C) is expressed specifically in the nervous system and that its loss in mice causes motor innervation defects that originate during development and lead to wasting and death before weaning. The defects range from severe reduction of motor axon extension as observed in the dorsal forelimb to shortening of presynaptic branches of the phrenic nerve, as observed in the diaphragm. Molecular functional analysis showed that in the context of the spinal cord Ark2C enhances transcriptional responses of the Smad1/5/8 effectors, which are activated (phosphorylated) downstream of Bone Morphogenetic Protein (BMP) signals. Consistent with Ark2C-modulated BMP signaling influencing motor axons, motor pools in the spinal cord were found to harbor phosphorylated Smad1/5/8 (pSmad) and treatment of primary MN with BMP inhibitor diminished axon length. In addition, genetic reduction of BMP-Smad signaling in Ark2C (+/-) mice caused the emergence of Ark2C (-/-) -like dorsal forelimb innervation deficits confirming that enhancement of BMP-Smad responses by Ark2C mediates efficient innervation. Together the above data reveal an involvement of BMP-Smad signaling in motor axon advancement.


Conflict of interest statement

The authors have declared that no competing interests exist.

Figures

Figure 1
Figure 1. A novel Arkadia-like gene, Ark2C, is specifically expressed in the nervous system.
(A) Schematic representation of the Ark2 locus (Chromosome 18:E3) showing two promoters (P1 and P2) and the transcripts corresponding to Ark2N and C (Ensembl release 63, June 2011). (B) Homologous domains of Arkadia and Ark2: serine rich domains (yellow), nuclear localization signals (black), Arkadia homology domains (red), NRG-TIER domain (blue), and a RING domain (green). Conservation as indicated by the percentages. (C) Schematic representation of ROSAfary gene-trap insertion into the first intron of Ark2C and the expected resulting fusion transcripts. (D) Sequence flanking the insertion site of the ROSAfary gene-trap in intron1 of Ark2C. Intron1 is 80,577 bp long, and the gene-trap insertion is 13,048 bp from exon1. (E–H) X-gal staining showing Ark2C expression (E) at embryonic day 7.5 (E7.5), (F) at E11.5, (G) at E16.5, and (H) in the adult. (G) and (H) are vibrotome transverse sections. HF, Headfold; DRG, dorsal root ganglia; scale bars = 100 µm (E) and 500 µm (F–H). (I) Ark2C expression in the embryonic brain of mice wild type (wt) and homozygous for the P9-3f gene-trap measured by quantitative RT-PCR. Transcripts from exon (E) 1–2 span the gene-trap insertion site and from exon7–8 include the NRG-TIER and RING domains. N = 3 embryos of each genotype. Error bars represent ±SD. (J) Ark2N expression in mice wt and homozygous P9-3f gene-trap measured by quantitative RT-PCR. Error bars represent ±SD. The gene downstream of Ark2C is Loxhd1. Mutations in this gene do not exhibit similar to the P9-3f phenotypes (see Figures 2–4), indicating that the P93F gene trap is Ark2C gene specific.
Figure 2
Figure 2. Ark2C −/− mice exhibit abnormal forelimb posture and movement, inefficient breathing and feeding.
(A) wt (+/+) and Ark2C −/− (−/−) mice at postnatal day zero (P0). Black arrowheads indicate the relaxed paw posture. (B) Growth curves of Ark2C −/− mice and their littermates between P0 and P20. Error bars represent ±SD between individuals. (C) P21 Ark2C −/− mice and littermate, showing (1) less and (2) more severe phenotypes. Black arrowheads, defective limbs. (D) Blood plasma lactate concentrations from 9 wt and 7 Ark2C −/− mice at P21 and adult. Error bars represent ±SD of three readings for each individual; * p<0.05. (E) Representative footprints from 4 Ark2C +/+ and 2 Ark2C −/− adult mice. (F) Histograms showing the percentage of footprints according to how clear the toe prints are. (G) Pawprint trail showing measurements analyzed. (H) Histograms showing results of pawprint analysis from 9 wt and 7 Ark2C −/− mice. Error bars represent ±SD between individuals; * p<0.05; ** p<0.01.
Figure 3
Figure 3. Muscles develop normally but atrophy in adult stages in the absence of Ark2C.
(A) Extensor muscles from wt and Ark2C −/− adult mice. ECRL, extensor carpi radialis longus; ECRB, extensor carpi radialis brevis; EDC, extensor digitorum communis; EDQ, extensor digiti quinti; R, right limb; L, left limb; scale bars = 1 mm. Dot plot showing the ratio of width/length for the muscles from 4 wt and 8 Ark2C −/− mice. Error bars represent ±SEM; * p<0.05; ** p<0.01. (B) Whole-mount immunofluorescence (IF) showing developing forelimb extensor muscle at E13.5; yellow arrowhead, extensor carpi and digiti muscles; scale bars = 250 µm. (C) Quantitative RT-PCR showing that Ark2C is not expressed in E12.5 forelimb (n = 3 wt embryos) as compared to spinal cord expression in wt (positive control) and Ark2C −/− (negative control) embryos. Transcripts measured from exon7–8 including the NRG-TIER and RING domains. Error bars represent ±SD.
Figure 4
Figure 4. Reduced motor neuron axon growth is observed in the forelimb in the absence of Ark2C.
(A) Confocal images from whole-mount IF with anti-GFP showing forelimb innervation in E11.5 HB9-eGFP transgenic embryos. Yellow arrow shows r, radial nerve; u, ulnar nerve; proximal limb to the left; scale bars = 250 µm. (B) Schematic representation of forelimb motor innervation at E11.5. Blue lines indicate measurement of radial and ulnar nerve length from the end of the brachial plexus (dashed red line), orange arrows indicate measurement of nerve width (mean of three measurements), and blue dotted line represents region of volumetric measurements of the brachial plexus. (C–E) Quantification of length and width of the radial and ulnar nerves and volume of the brachial plexus at E11.5; N, number of forelimbs (C–E,H); error bars represent ±SD; ** p<0.01; ns, not significant. (F) Confocal images from whole-mount IF with anti-GFP showing forelimb innervation in E12.5–13.5 HB9-eGFP transgenic embryos. Orange, green, red, and blue arrows, as explained in (G), proximal limb to the left; scale bars = 250 µm. (G) An example of an E13.5 Ark2C −/− embryo showing less severe forelimb innervation defects and a schematic representation of the major bifurcation points of the radial nerve at E13.5. Blue (1) and red (2) arrows show branches innervating muscles groups that include EDC and EDQ; green arrow (3) shows branches innervating ECRB and ECRL; orange arrow (4), innervation of more proximal muscles of the dorsal forelimb. (H) Quantification of the severity of the innervation phenotype showing percentage of forelimbs with each classification as indicated at E13.5.
Figure 5
Figure 5. Reduced motor neuron axon growth is also observed in the diaphragm in the absence of Ark2C.
(A) Whole-mount IF of diaphragm muscle showing the phrenic nerve and synapses in the entire muscle at P0; purple box shows area analyzed in (B); scale bars = 1 mm. (B) Higher magnification images at E18.5 and P17. α-Bungarotoxin (green), postsynaptic marker; neurofilament and synaptophysin (red), axons and presynaptic terminals; scale bars = 10 µm. (C) Histogram showing the measurements of axon length from the phrenic to the synapses in wt and Ark2C −/− diaphragms at E18.5 and P17; N, number of axons. Error bars represent ±SEM; ** p<0.01; *** p<0.001. (D) Ark2C expression in wt and Ark2C −/− embryonic (E12.5) spinal cord and wt (E19.5, n = 2) diaphragm muscle measured by quantitative RT-PCR as in Figure 3C.
Figure 6
Figure 6. Motor neuron specification is normal in the absence of Ark2C expression.
(A) IF showing Ark2C expression (β-gal, green) and FoxP1 (red) in spinal cord at E13.5; scale bars = 250 µm and 50 µm for the magnified insert. (B) IF showing motor pool marker expression in spinal cord at E13.5. (C) Percentages showing the number of FoxP1-expressing cells (LMC) that also express Isl1 (LMCm) or high Hb9 (LMCl) are shown in the histogram; N, number of cells; n.s., not significant; scale bars = 50 µm.
Figure 7
Figure 7. Ark2C enhances the transcriptional responses of Smad1/5/8.
(A) CAGA12-luciferase activity in Arkadia-null mouse embryonic fibroblasts transfected with plasmids expressing GFP, GFP-Ark (GArk), or GFP-Ark2C (GArk2C). Error bars represent ±SEM; N = 4 for all; *** p<0.001. (B) CAGA12-luciferase activity in chick neural tubes electroporated with GFP or GArk2C and Activin. Error bars represent ±SEM. N, number of embryos. (C–E) BRE-luciferase activity in chick neural tube electroporated with plasmids expressing GFP, GArk, GArk2C, GFP-hArk2CΔRING (GΔRING), or BMP4. Error bars represent ±SEM; N, number of embryos; * p<0.05.
Figure 8
Figure 8. Ark2C enhances BMP signaling by degrading negative regulators of the pathway.
Immunoblots (IB) showing pSmad1/5/8 and total Smad1/5/8 (tS1/5/8) (A), Smad6/7 (C), and Ski, SnoN (E) in 293T and stable clones of 293T-GArk2C cells treated with dorsomorphin (Inh.) or BMP4 in serum-free medium. Protein levels of pSmad1/5/8, Smad6/7, and Ski were quantified, normalized to PCNA, and the relative protein levels are shown in arbitrary units in the histographs (B, D, and F, respectively). Untr, untreated cells cultured in 10% FBS; arrows indicate the bands used for quantification. (G) Model for derepression of transcription by Ark2C. Upon BMP stimulation, complexes form between pS1/5/8 and Smad4, and the negative regulators Ski/SnoN repress these complexes on gene promoters. Repressed complexes are degraded by Ark2C (top), allowing freshly activated Smads to enhance transcription (bottom). The cycle is repeated as the Ski/SnoN presence is maintained and up-regulated by pSmad1/5/8.
Figure 9
Figure 9. Ark2C interacts with and ubiquitinates negative regulators via its RING domain.
(A) Immunoprecipitation (IP) in 293T-GArk2C cells after 1 h treatment with dorsomorphin (Inhibitor) or BMP4 in serum-free medium and in the presence of MG132. TL, total lysate; arrow, pSmad1/5/8 specific band. (B) IP in 293T-GArk2C cells showing interactions with mycSmad6 and mycSmad7 but not with mycSmad4. The same membrane was used for IB with a-GFP and leftover signal from mycSmad7 is indicated by *. (C) IP showing the ubiquitination of mycSki in 293T cells transfected as indicated. (D–E) IP showing the ubiquitination of mycSmad6 and mycSmad7 in 293T cells transfected as indicated. The expression of the proteins in the total lysates is shown in (F). Arrowheads indicate specific bands.
Figure 10
Figure 10. PLA showing that Ark2C interacts with components of the BMP pathway in situ.
Confocal images of Proximity Ligation Assay (PLA) performed in NSC-34 cells transfected with GFP-Ark2C and treated for 1 h as indicated showing interaction of Ark2C with endogenous pSmad1/5/8 (A) or Ski (B). The use of a single antibody served as negative control. PLA signal from transfected cells (3–5) was quantified, and the results are shown in the histogram on the right. Red spots, PLA signal; blue, DAPI-nucleus; scale bars = 10 µm.
Figure 11
Figure 11. BMP-Smad signaling is present in motor pools and enhances MN axon growth in culture.
(A) Confocal images from PLA in NSC-34 cells showing pSmad1/5/8-Smad4 complexes after treatment with dorsomorphin (Inhibitor) or BMP4. The omission of the primary antibodies or the use of a single antibody served as negative controls. Red spots, PLA signal; blue, DAPI-nucleus; scale bars = 10 µm. (B) IB showing pSmad1/5/8 in NSC-34 cells treated with dorsomorphin (Inh) or BMP4 and 7. PCNA was used as loading control; * specific band. (C–D) Representative IF confocal images showing neurofilament in NSC-34 cells after 72 h of treatment with 1% FBS+dorsomorphin (Inhibitor) or 1% FBS+BMP4. Nontreated cells were maintained in 1% FBS. Cells with long axons (as measured in Figure S6D) were counted and percentage to the total number of cells is shown in a histograph. Scale bars = 200 µm; N, number of cells; error bars represent ±SD between experiments and reflect counts in different slides; ** p<0.01; n.s., not significant. (E–F) Confocal images of primary MN derived from E13.5 HB9-eGFP embryos stained with anti-GFP antibody after treatment for 72 h with dorsomorphin (Inhibitor) or BMP4. The length of the axons was measured and shown in the histograph. ** p<0.01; N, number of cells; n.s., not significant. (G) Confocal images of brachial spinal cord vibrotome sections after PLA detecting pSmad1/5/8-Smad4 complexes in the spinal cord at E13.5; lower panels, the omission of the primary antibodies served as negative control. Red spots, PLA signal; blue, DAPI-nucleus; scale bars = 50 µm. (H) IF showing pSmad1/5/8 and FoxP1 in brachial motor pools of E13.5 wt and Ark2C −/− embryos. Scale bars = 50 µm.
Figure 12
Figure 12. Genetic reduction of BMP signaling and Ark2C in motor pools reproduces the dorsal forelimb innervation defects.
(A–B) Confocal images of whole-mount IF with anti-GFP showing motor neuron innervation of the forelimb in HB9-eGFP embryos from crosses between Ark2C +/−;BMPRII +/− and Ark2C +/− (A) and between Ark2C +/−;Smad8 +/− and Smad8 −/− (B). Arrows as in Figures 4F and S7A; scale bars = 250 µm. (C) Quantification of the innervation at E13.5 shown as percentages of forelimbs, each phenotypic classification as described; N, number of forelimbs. (D) The population spread of average hang time in the cage lid test for each genotype. Ark2C Smad8 littermates, mix of Ark2C+/+:Smad8 +/−, Ark2C+/+:Smad8 −/−. Ark2C +/−:Smad8 +/−. ** p<0.01. (E) Transverse section of E15.5 Smad8 +/− embryo at brachial level after X-gal staining showing Smad8 expression in bone, cartilage, DRG, and motor pools. Numbers as in “The Atlas of Mouse Development” 31*, 32*, 54* on pp 266–267 and 28, 31, 34, 39, 42, 43, 49, 54 on pp 268–269; mm, muscle mass; MN, motor neurons. (F) Sagittal and transverse (C′ and C″) vibrotome sections of the spinal cord from a Smad8 +/− embryo stained with X-gal showing Smad8 expression in motor pools or co-stained with antibody against FoxP1. White arrowhead, DRG; blue, cytoplasmic X-gal stain of Smad8 expression; brown, nuclear FoxP1 expression; sagittal section, dorsal towards top; scale bars = 100 µm. Dotted line indicates position of sagittal section in the first panel; first rib is indicated by black arrowhead.

Similar articles

Cited by

References

    1. Hippenmeyer S, Kramer I, Arber S (2004) Control of neuronal phenotype: what targets tell the cell bodies. Trends Neurosci 27: 482–488. - PubMed
    1. Salie R, Niederkofler V, Arber S (2005) Patterning molecules; multitasking in the nervous system. Neuron 45: 189–192. - PubMed
    1. Shirasaki R, Pfaff SL (2002) Transcriptional codes and the control of neuronal identity. Annu Rev Neurosci 25: 251–281. - PubMed
    1. Rossi F, Gianola S, Corvetti L (2007) Regulation of intrinsic neuronal properties for axon growth and regeneration. Progress in neurobiology 81: 1–28. - PubMed
    1. Barnes AP, Polleux F (2009) Establishment of axon-dendrite polarity in developing neurons. Annual review of neuroscience 32: 347–381. - PMC - PubMed

Publication types

MeSH terms