. 2013 Apr 15:4:44.
doi: 10.3389/fphar.2013.00044. eCollection 2013.

Histone deacetylase inhibition reduces cardiac connexin43 expression and gap junction communication

Affiliations

Histone deacetylase inhibition reduces cardiac connexin43 expression and gap junction communication

Qin Xu et al. Front Pharmacol. .

Abstract

Histone deacetylase inhibitors (HDACIs) are being investigated as novel therapies for cancer, inflammation, neurodegeneration, and heart failure. The effects of HDACIs on the functional expression of cardiac gap junctions (GJs) are essentially unknown. The purpose of this study was to determine the effects of trichostatin A (TSA) and vorinostat (VOR) on functional GJ expression in ventricular cardiomyocytes. The effects of HDAC inhibition on connexin43 (Cx43) expression and functional GJ assembly were examined in primary cultured neonatal mouse ventricular myocytes. TSA and VOR reduced Cx43 mRNA, protein expression, and immunolocalized Cx43 GJ plaque area within ventricular myocyte monolayer cultures in a dose-dependent manner. Chromatin immunoprecipitation experiments revealed altered protein interactions with the Cx43 promoter. VOR also altered the phosphorylation state of several key regulatory Cx43 phospho-serine sites. Patch clamp analysis revealed reduced electrical coupling between isolated ventricular myocyte pairs, altered transjunctional voltage-dependent inactivation kinetics, and steady state junctional conductance inactivation and recovery relationships. Single GJ channel conductance was reduced to 54 pS only by maximum inhibitory doses of TSA (≥ 100 nM). These two hydroxamate pan-HDACIs exert multiple levels of regulation on ventricular GJ communication by altering Cx43 expression, GJ area, post-translational modifications (e.g., phosphorylation, acetylation), gating, and channel conductance. Although a 50% downregulation of Cx43 GJ communication alone may not be sufficient to slow ventricular conduction or induce arrhythmias, the development of class-selective HDACIs may help avoid the potential negative cardiovascular effects of pan-HDACI.

Keywords: connexin40; connexin43; gap junctions; phosphorylation; trichostatin A; vorinostat.


Figures

FIGURE 1
FIGURE 1
Ventricular HDAC expression and inhibition. (A) The mRNA expression levels for all 11 mammalian HDACs and two connexins, Cx43 and Cx40, were detected by real-time PCR using the SYBR® GreenERTM qPCR SuperMix (Invitrogen) and custom-designed forward and reverse primers. The data was averaged from three experiments. (B,C) Total HDAC activity was measured in ventricular myocyte and stable Cx43-transfected HeLa cell (HeLa-Cx43) cultures by deacetylated Fluor-de-Lys® fluorescence during trichostatin A (TSA) (B) or vorinostat (VOR) inhibition (C). All data were normalized to the background subtracted maximum relative fluorescence of the control well. The data from three experiments were averaged and fitted with a second-order exponential decaying function in Origin7.5 and the equilibrium inhibition constants (KI) were calculated from the expression KI = 0.693/[HDACI]decay constant. (D) A series of 1:10 dilutions of the deacetylated Fluor-de-Lys substrate were combined with the developer and fluorescence counts were obtained with the BIO-TEK Synergy plate reader in conjunction (i.e., parallel) with the cell-based HDAC activity assays. The background (empty well) subtracted fluorescence emission at 460 nm increased linearly with the concentration of the deacetylated substrate. The experiments were performed in triplicate (mean ± SEM).
FIGURE 2
FIGURE 2
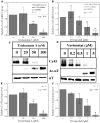
Dose-dependent alteration of Cx43 expression by pan-HDACI. (A,B) Real-time PCR results of Cx43 mRNA expression levels after overnight inhibition by increasing [TSA] (A) and [VOR] (B) relative to control (untreated) values. Experiments were performed in triplicate and the lowest dose of both pan-HDACI produced an insignificant increase in average Cx43 mRNA levels and a significant reduction in Cx43 mRNA levels at the highest doses. (C,D) Representative Cx43 western blots of ventricular cell lysates from TSA (C) or VOR (D) treated cultures. (E,F) Statistical analysis of the protein densitometry scans from three experiments reveal significant dose-dependent reductions in Cx43 protein content. Cx43 protein levels were normalized to a control sample from each experiment with α-tubulin (αT) expression used as an internal control and acetylated α-tubulin (Ac-αT) as a positive indicator for HDAC inhibition.
FIGURE 3
FIGURE 3
Reduction of Cx40 and N-cadherin expression by HDACI. (A) Overnight (18 h) treatment with 1 μM VOR significantly reduced Cx43 and N-cadherin mRNA levels by 45 ± 5 and 30 ± 6%, respectively. Experimental mean values were statistically different from control values (p-value < 0.05, one-way ANOVA). (B) Immunoblots were also performed for Ncad and β-actin (internal control). Total Ncad levels from three experiments were decreased by 1 μM VOR relative to control (untreated) samples. (C) Representative Cx40 western blots of atrial cell lysates from control or 1 μM VOR-treated cultures. (D) Statistical analysis of the protein densitometry scans from four experiments reveals a significant reduction in Cx40 protein content. Cx40 protein levels were normalized to a control sample from each experiment with α-tubulin expression used as an internal control and acetylated α-tubulin (Ac-αT) as a positive indicator for HDAC inhibition.
FIGURE 4
FIGURE 4
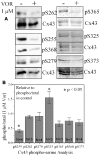
Alteration of Cx43 phosphorylation state by vorinostat. (A) Representative western blot of control and 1 μM VOR-treated ventricular myocyte lysates detected with Cx43 phospho-serine (pSer) specific anti-pS255, anti-pS262, anti-pS279/282, anti-pS368, anti-pS325/328/330, anti-pS365, and anti-pS373 antibodies. The total Cx43 was also immunoblotted with an anti-Cx43 carboxyl-terminal antibody that recognizes all forms of Cx43. (B) Cx43 phospho-serine pS255, pS262, pS279/282, pS368, pS325/328/330, pS365, and pS373 levels were compared by densitometry to the total Cx43 levels in control and 1 μM VOR-treated samples to generate the phospho/total Cx43 ratios. The VOR-treated phospho/total Cx43 ratios are plotted relative to control Cx43 phospho/total ratio.
FIGURE 5
FIGURE 5
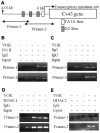
Alteration of Cx43 promoter associated proteins by vorinostat. (A) Illustration of the Cx43 promoter region up to -0.5 kb from the Cx43 gene (Gja1) transcription start site of Cx43 with TATA and GC boxes indicated. Two primer sets were designed from -511 to -206 and -225 to +65 bp of the Cx43 promoter region. (B,C) Chromatin immunoprecipitation assays illustrate the reduced binding of RNA polymerase II (RNA Pol II) and specific protein 1 (Sp1) to the promoter region of Cx43 after overnight exposure to 2 μM VOR. (D,E) A chromatin immunoprecipitation assay was performed with rabbit IgG and rabbit anti-HDAC1 or anti-HDAC2 antibodies to assess the binding of HDAC1 (D) and HDAC2 (E) to the promoter region of the Cx43 gene (Gja1). Overnight treatment with 2 μM VOR enhanced the association of HDAC1 and HDAC2 to the Gja1 promoter.
FIGURE 6
FIGURE 6
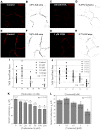
Measurement of Cx43 GJ area and ventricular electrical coupling. (A–H) Representative confocal images of mouse primary anti-Cx43 and goat anti-mouse Alexa Fluor 546 secondary antibody immunolocalized Cx43 gap junction plaques from 4-day ventricular myocyte cultures (A,C,E,G) and their corresponding black-on-white bitmaps of the Cx43-positive pixels (B,D,F,H). The total GJ area was calculated relative to the total image area of the confluent monolayer cardiomyocyte cluster. Five clusters were imaged per coverslip and each experiment was repeated in triplicate for each [TSA] and [VOR]. (I,J) Statistical analysis of the average Cx43 GJ area values (±SEM, n = 15) at each pan-HDACI concentration revealed a significant decrease in GJ area for [TSA] ≥ 50 nM and [VOR] ≥ 500 nM. (K,L) Initial gap junction conductance (gj) measurements, upon establishment of the dual whole cell patch clamp configuration, from numerous (n = 14–34) cell pairs revealed a dose-dependent maximum decrease in ventricular gj of 40–50% by pan-HDACI. The decline in ventricular gj was statistically significant for [TSA] ≥ 35 nM and [VOR] ≥ 1 μM.
FIGURE 7
FIGURE 7
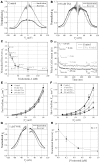
Vj-dependent gating of ventricular gap junctions during HDAC inhibition. A 200 ms/mV Vj ramp from 0 to ±120 mV was applied to patch clamped ventricular myocyte pairs and Vj was returned to 0 mV by ramp reversal to produce the normalized junctional conductance–voltage (GjVj) inactivation and recovery curves. The black line represents the normalized gj during the increasing Vj (inactivation) ramp and the gray line is the GjVj curve obtained during the decreasing Vj (recovery) ramp. The facilitated recovery of gj was observed as an increase in the normalized gj (Gj) of the recovery curve relative to the initial slope gj of the ventricular gap junctions during the increasing (inactivation) phase of the Vj ramp (inactivation curve normalized slope gj = 1.0). The smooth black and gray lines are Boltzmann equation fits of the ventricular GjVj curves obtained from five to six experiments from control myocytes (A), 100 nM TSA-treated myocytes (B), or 1 μM VOR (G). The parameters for the Boltzmann fits of the 100 nM TSA and 1 μM VOR GjVj inactivation and recovery curves are listed in Table 1. (C) The slope Gj of the recovery GjVj curves was increased in normal ventricular myocytes and abolished by TSA treatments in a dose-dependent manner. (D) The inactivation kinetics were determined in control and TSA-treated ventricular myocyte pairs by ensemble averaging the Ij from 5 to 10 Vj pulses from -70 to -140 mV. The ensemble averaged Ij trace was fitted with a second-order decaying function and the fast and slow inactivation rates were calculated from the expression kon = (1 - Popen)/τdecay. One example is shown for a control (black line) and 100 nM TSA-treated (gray line) myocyte pair in response to a train of -120 mV Vj pulses. (E,F) The fast (E) and slow (F) on-rates for hypothesized inactivation particles were plotted relative to the absolute value of the Vj pulses and fitted with first-order exponential increasing functions. The fast inactivation rates were not affected by TSA while the amplitude, but not the Vj-dependence, of the slow inactivation rates were progressively reduced by increasing TSA concentrations. (G) The smooth black and gray lines are Boltzmann equation fits of the ventricular GjVj curves obtained from five 1.0 μM VOR-treated myocyte pairs (see Table 1). (H) The slope Gj of the recovery GjVj curves, increased under normal conditions, was abolished by VOR treatments in a dose-dependent manner.
FIGURE 8
FIGURE 8
Single gap junction channel conductance (γj) of HDACI-treated ventricular myocytes. (A) A representative example of single channel open–closed events during an Ij recording in response to a +60 mV, 30 s Vj pulse applied to a pair of primary cultured ventricular myocytes. Note the activity of low (30–50 pS), intermediate (60–80 pS), and high (90–110 pS) γj states typical of Cx43 GJ channel activity. (B) An example of GJ channel activity recorded from a pair of ventricular myocytes treated with 100 nM TSA during a -40 mV, 30 s Vj pulse. Only low (30–50 pS) γj channel activity was observed in this experiment. (C) Single gap junction channel current (ij) amplitudes were measured from all point histograms for every Vj pulse obtained from three different 100 nM TSA-treated ventricular myocyte cell pairs. Linear regression analysis of the composite ijVj relationship had a slope conductance of 54 ± 1 pS. (D) Representative example of single channel open–closed events during an Ij recording in response to a +40 mV, 30 s Vj pulse applied to a pair of primary cultured ventricular myocytes treated with 5 μM VOR. In two 5 μM VOR-treated ventricular myocyte pairs, only intermediate 80 pS GJ channel activity was observed, consistent with the intermediate γj state of Cx43

Similar articles

Cited by

References

    1. Arnold J. M., Phipps M. W., Chen J., Phipps J. (2005). Cellular sublocalization of Cx43 and the establishment of functional coupling in IMR-32 neuroblastoma cells. Mol. Carcinog. 42 159–169 - PubMed
    1. Bradner J. E., West N., Grachan M. L., Greenberg E. F., Haggarty S. J., Warnow T., et al. (2010). Chemical phylogenetics of histone deacetylases. Nat. Chem. Biol. 6 238–243 - PMC - PubMed
    1. Butler K. V., Kalin J., Brochier C., Vistoli G., Langley B., Kozikowski A. P. (2010). Rational design and simple chemistry yield a superior, neuroprotective HDAC6 inhibitor, tubastatin A. J. Am. Chem. Soc. 132 10842–10846 - PMC - PubMed
    1. Colussi C., Berni R., Rosati J., Straino S., Vitale S., Spallotta F., et al. (2010). The histone deacetylase inhibitor suberoylanilide hydroxamic acid reduces cardiac arrhythmias in dystrophic mice. Cardiovasc. Res. 87 73–82 - PubMed
    1. Colussi C., Rosati J., Straino S., Spallotta F., Berni R., Stilli D., et al. (2011). Nε-lysine acetylation determines dissociation from gap junctions and lateralization of connexin 43 in normal and dystrophic heart. Proc. Natl. Acad. Sci. U.S.A. 108 2795–2800 - PMC - PubMed

LinkOut - more resources