. 2013 Jun;41(11):5614-25.
doi: 10.1093/nar/gkt222. Epub 2013 Apr 16.

Tumor suppressor p53 plays a key role in induction of both tristetraprolin and let-7 in human cancer cells

Affiliations

Tumor suppressor p53 plays a key role in induction of both tristetraprolin and let-7 in human cancer cells

Ji Young Lee et al. Nucleic Acids Res. 2013 Jun.

Abstract

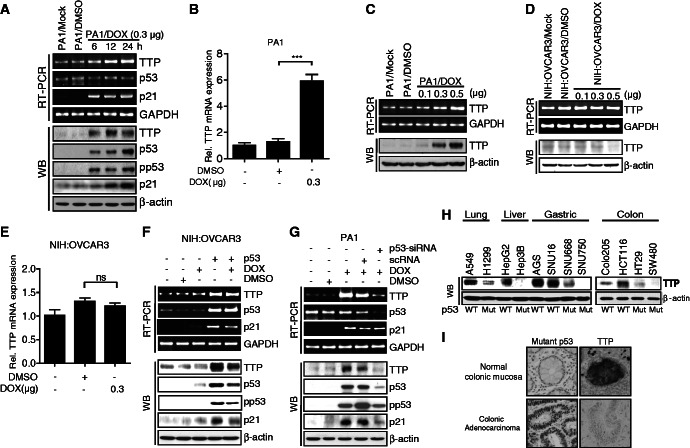
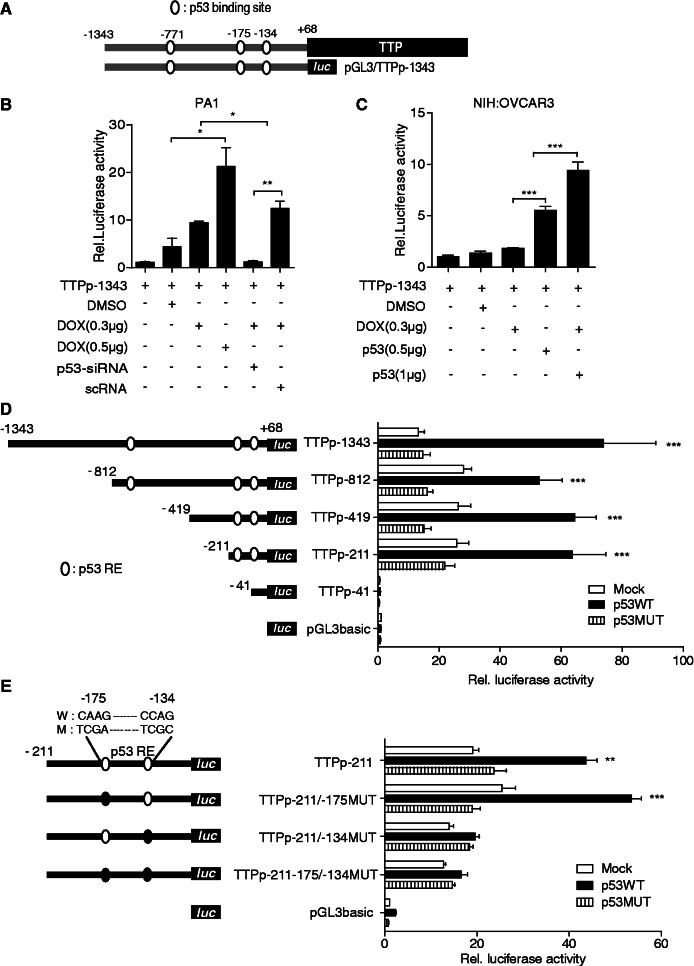
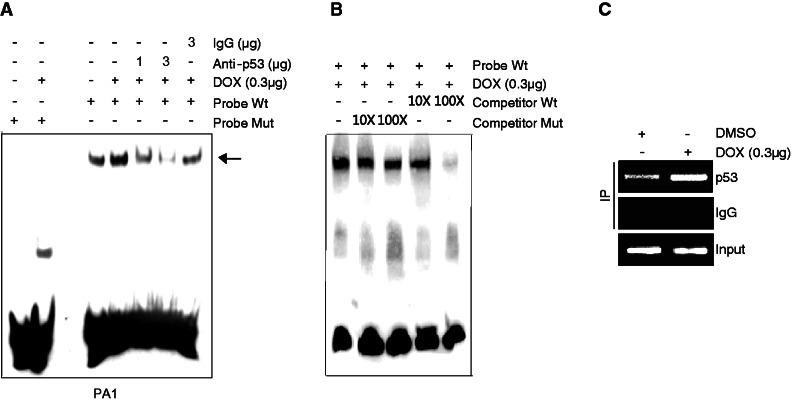
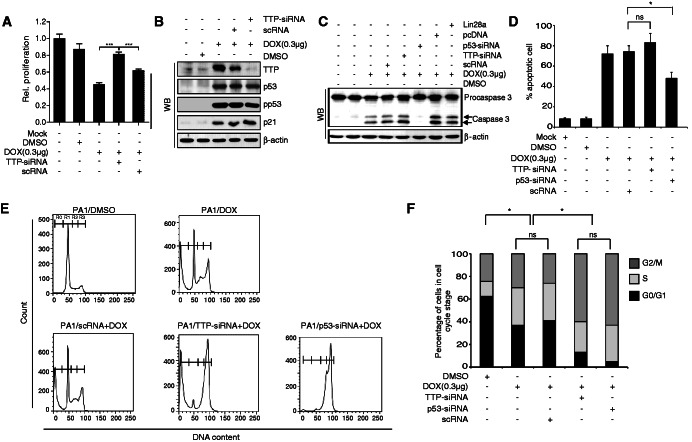
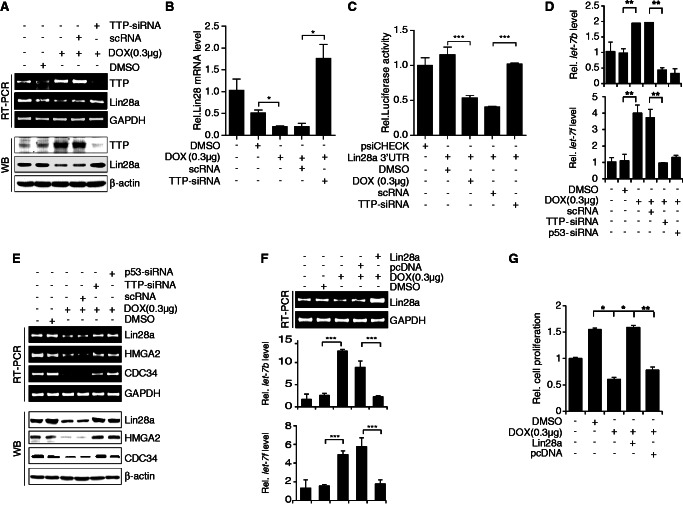
Tristetraprolin (TTP) and let-7 microRNA exhibit suppressive effects on cell growth through down-regulation of oncogenes. Both TTP and let-7 are often repressed in human cancers, thereby promoting oncogenesis by derepressing their target genes. However, the precise mechanism of this repression is unknown. We here demonstrate that p53 stimulated by the DNA-damaging agent doxorubicin (DOX) induced the expression of TTP in cancer cells. TTP in turn increased let-7 levels through down-regulation of Lin28a. Correspondingly, cancer cells with mutations or inhibition of p53 failed to induce the expression of both TTP and let-7 on treatment with DOX. Down-regulation of TTP by small interfering RNAs attenuated the inhibitory effect of DOX on let-7 expression and cell growth. Therefore, TTP provides an important link between p53 activation induced by DNA damage and let-7 biogenesis. These novel findings provide a mechanism for the widespread decrease in TTP and let-7 and chemoresistance observed in human cancers.


Figures

Figure 1.
Figure 1.
DOX induces expression of TTP mRNA and protein by a p53-dependent mechanism in human cancer cells. (A–C) DOX increases TTP levels in p53 wild-type human ovarian cancer PA1 cells. PA1 cells were treated with the indicated concentration of DOX for (A) the indicated length of time or (B, C) 24 h. The levels of TTP, p53 and p21 were measured by semi-qRT-PCR (A and C, top), qRT-PCR (B) and western blotting (A and C, bottom). The level of phospho-p53 (pp53) was measured by western blotting (A, bottom). Values are means ± SD (n = 3). ***P < 0.001. (D–G) p53 is required for DOX-induced expression of TTP. (D, E) p53 mutant human ovarian cancer NIH:OVCAR3 cells were treated with the indicated concentration of DOX for 24 h. The level of TTP was measured by semi-qRT-PCR (D, top), qRT-PCR (E) and western blotting (D, bottom). Vaules are means ± SD (n = 3). ns, not significant. (F) NIH:OVCAR3 cells were transfected with pCMV-p53WT. After treatment with 0.3 μg/ml of DOX for 24 h, the levels of TTP, p53 and p21 were measured by semi-qRT PCR (top) and western blotting (bottom). (G) PA1 cells were transfected with siRNA against p53 (p53-siRNA) or scRNA. After treatment with DOX for 24 h, the levels of TTP, p53, and p21 were measured by semi-qRT PCR (top) and western blotting (bottom). (H) The level of TTP protein is inversely correlated with that of p53 protein in several human cell lines. Levels of TTP and p53 proteins were determined by western blot analysis in lung adenocarcinoma (A549 and H1299), hepatocellular carcinoma (HepG2 and Hep3B), gastric adenocarcinoma (AGS, SNU16, SNU668 and SNU750), colon adenocarcinoma (Colo205, HCT116, HT29 and SW480). WT, p53 wild type; Mut, p53 mutant. (I) TTP expression levels are inversely correlated with that of mutant p53 in human colon tissues. Representative immunohistochemical staining of TTP and mutant p53 in normal and colon adenocarcinoma tissues.
Figure 2.
Figure 2.
DOX induces TTP promoter activity in a p53-dependent manner. (A) Schematic structure of the reporter construct pGL3/TTPp-1343. The TTP promoter contains three potential p53 half-sites at positions −771, −175 and −134 relative to the transcription start site. (B, C) DOX induces TTP promoter activity in a p53-dependent manner. (B) PA1 cells were co-transfected with pGL3/TTPp-1343 containing the TTP promoter (−1343 to +68) and p53-siRNA or scRNA. (C) NIH:OVCAR3 cells were co-transfected with pGL3/TTPp-1343 and pCMV-p53WT (p53 wild type) or pCMV-p53MUT (p53 mutant). After treatment with DOX for 24 h, luciferase activity was measured. The expression levels obtained from pGL3/TTPp-1343-transfected cells without DOX treatment were set to 1. Values are means ± SD (n = 3). *P < 0.05; **P < 0.01; ***P < 0.001. (D, E) p53 half-site at −134 relative to the transcription start site is required for the transcriptional activation of the TTP promoter. (D) Deletion and (E) mutation analysis of the TTP promoter in NIH:OVCAR3 cells. Schematic structures of the deletion and point mutation reporter constructs are shown on the left. Three potential p53 half-sites are indicated with open circles. The point mutations introduced into the binding sites are represented as closed circles. NIH:OVACAR3 cells were co-transfected with the TTP promoter construct and pCMV-p53WT or pCMV-p53MUT. After treatment with DOX for 24 h, cells were lysed and assayed for luciferase activity. The levels of firefly luciferase activity were normalized to Renilla luciferase activity. The expression levels obtained from pGL3 basic-transfected cells were set to 1. Values are means ± SD (n = 3). **P < 0.01; ***P < 0.001.
Figure 3.
Figure 3.
DOX enhances binding of p53 to the TTP promoter. (A, B) EMSA and (C) ChIP assay. PA1 cells were treated with DOX for 24 h. (A) EMSA was performed as described in Experimental Procedures. Biotinylated oligonucleotide containing wild-type (WT) or mutant (MUT) p53 half-site at −134 of the TTP promoter was used as a probe. To identify p53 immunoreactivity in the DNA–protein complexes, nuclear extracts were incubated with anti-p53 antibody or non-specific mouse IgG before addition of the biotinylated probe. An arrow indicates the position of the DNA–protein complexes containing p53. (B) Competition experiments were performed using a 100-fold excess of unlabeled WT and MUT p53 probes. (C) ChIP analysis was performed to confirm the interaction of p53 with the TTP promoter in vivo in PA1 cells. Formaldehyde cross-linked chromatin from PA1 cells was incubated with anti-p53 antibody or with non-specific IgG. Total input DNA at a 1:10 dilution was used as positive control for the PCR reaction. Immunoprecipitated DNA was analyzed by PCR with primers specific for the TTP promoter.
Figure 4.
Figure 4.
TTP mediates the inhibitory effect of DOX on cell growth. (A, B) Down-regulation of TTP by siRNA attenuates the inhibitory effect of DOX on cell growth. PA1 cells were transfected with TTP-specific (TTP-siRNA) or scRNA. After treatment with DOX for 24 h, (A) cell viability was assessed by measuring absorbance at 490 nm using a MTS cell proliferation assay and (B) the levels of TTP, p53, pp53 and p21 were measured by western blotting. The values obtained with mock-treated PA1 cells were set to 1. Values are means ± SD (n = 3). ***P < 0.001. (C, D) Down-regulation of TTP by siRNA does not affect DOX-induced apoptosis. PA1 cells were transfected with TTP-siRNA, p53-siRNA, scRNA), pcDNA3/Flag-Lin28a or pcDNA3/Flag. After treatment with DOX for 24 h, (C) the levels of procaspase-3 and caspase-3 were measured by western blotting. (D) Cells were labeled with an Annexin-V-FLUOS staining kit for quantitating cells undergoing apoptosis. Values are means ± SD (n = 3). *P < 0.05. ns, not significant. (E, F) Down-regulation of TTP by siRNA alters the effect of DOX on the cell cycle. PA1 cells were transfected with TTP-siRNA, p53-siRNA or scRNA. (E) After treatment with DOX for 24 h, cells were stained with propidium iodide and cell cycle distribution and apoptotic DNA fragmentation (Sub-G1) were analyzed by flow cytometry. Data are representative of three independent experiments. R0, sub-G1; R1, G0/G1; R2, S; R3, G2/M. (F) Percentage of cells at each phase in different groups. (n = 3). *P < 0.05. ns, not significant.
Figure 5.
Figure 5.
DOX increases let-7 levels through the p53-TTP-Lin28 pathway. (A–C) DOX decreases Lin28 levels in a TTP-dependent manner. (A, B) PA1 cells were transfected with TTP-siRNA or scRNA. After treatment with DOX for 24 h, the levels of TTP and Lin28a were measured by semi-qRT-PCR (A, top), western blotting (A, bottom) and qRT-PCR (B). Values are means ± SD (n = 3). *P < 0.05. (C) PA1 cells were co-transfected with psiCHECK2 luciferase reporter constructs containing fragments derived from the 3′-UTR of Lin28a mRNA and TTP-siRNA or scRNA. After treatment with DOX for 24 h, cells were lysed and assayed for luciferase activity. The levels of firefly luciferase activity were normalized to Renilla luciferase activity. Luciferase activity obtained from PA1 cells transfected with psiCHECK2 alone was set to 1.0. Values are means ± SD (n = 3). ***P < 0.001. (D–G) DOX increases let-7 levels through the p53-TTP-Lin28 pathway. (D, E) PA1 cells were transfected with TTP-siRNA, p53-siRNA, or scRNA. After treatment with DOX for 24 h, (D) the levels of TTP, p53, Lin28, HMGA2, and CDC34 were measured by semi-qRT-PCR (top) and western blotting (bottom) and (E) the levels of mature-miRNA for let-7 b and let-7f were determined by qRT-PCR. The levels obtained from untreated PA1 cells were set to 1. Values are means ± SD (n = 3). **P < 0.01. (F, G) PA1 cells were transfected with pcDNA3/Flag-Lin28a or pcDNA3/Flag. After treatment with DOX for 24 h, (F) the level of Lin-28 a was measured by semi-qRT-PCR (top panel) and western blotting (bottom panel) and the levels of mature-miRNA for let-7 b and let-7f were determined by qRT-PCR and (G) cell viability was assessed by measuring absorbance at 490 nm using a MTS cell proliferation assay. Values are means ± SD (n = 3). *P < 0.05; **P < 0.01; ***P < 0.001.

Similar articles

Cited by

References

    1. Riley T, Sontag E, Chen P, Levine A. Transcriptional control of human p53-regulated genes. Nat. Rev. Mol. Cell Biol. 2008;9:402–412. - PubMed
    1. Vogelstein B, Lane D, Levine AJ. Surfing the p53 network. Nature. 2000;408:307–310. - PubMed
    1. Vousden KH, Lu X. Live or let die: the cell's response to p53. Nat. Rev. Cancer. 2002;2:594–604. - PubMed
    1. Soussi T, Beroud C. Assessing TP53 status in human tumours to evaluate clinical outcome. Nat. Rev. Cancer. 2001;1:233–240. - PubMed
    1. Sbisa E, Catalano D, Grillo G, Licciulli F, Turi A, Liuni S, Pesole G, De Grassi A, Caratozzolo MF, D'Erchia AM, et al. p53FamTaG: a database resource of human p53, p63 and p73 direct target genes combining in silico prediction and microarray data. BMC Bioinformatics. 2007;8(Suppl.1):S20. - PMC - PubMed

Publication types

MeSH terms