CG methylated microarrays identify a novel methylated sequence bound by the CEBPB|ATF4 heterodimer that is active in vivo
- PMID: 23590861
- PMCID: PMC3668366
- DOI: 10.1101/gr.146654.112
CG methylated microarrays identify a novel methylated sequence bound by the CEBPB|ATF4 heterodimer that is active in vivo
Abstract
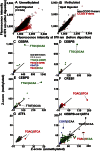
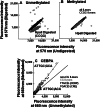
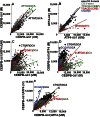
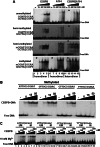
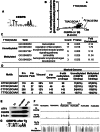
To evaluate the effect of CG methylation on DNA binding of sequence-specific B-ZIP transcription factors (TFs) in a high-throughput manner, we enzymatically methylated the cytosine in the CG dinucleotide on protein binding microarrays. Two Agilent DNA array designs were used. One contained 40,000 features using de Bruijn sequences where each 8-mer occurs 32 times in various positions in the DNA sequence. The second contained 180,000 features with each CG containing 8-mer occurring three times. The first design was better for identification of binding motifs, while the second was better for quantification. Using this novel technology, we show that CG methylation enhanced binding for CEBPA and CEBPB and inhibited binding for CREB, ATF4, JUN, JUND, CEBPD, and CEBPG. The CEBPB|ATF4 heterodimer bound a novel motif CGAT|GCAA 10-fold better when methylated. The electrophoretic mobility shift assay (EMSA) confirmed these results. CEBPB ChIP-seq data using primary female mouse dermal fibroblasts with 50× methylome coverage for each strand indicate that the methylated sequences well-bound on the arrays are also bound in vivo. CEBPB bound 39% of the methylated canonical 10-mers ATTGC|GCAAT in the mouse genome. After ATF4 protein induction by thapsigargin which results in ER stress, CEBPB binds methylated CGAT|GCAA in vivo, recapitulating what was observed on the arrays. This methodology can be used to identify new methylated DNA sequences preferentially bound by TFs, which may be functional in vivo.
Figures

Similar articles
-
The bZIP mutant CEBPB (V285A) has sequence specific DNA binding propensities similar to CREB1.Biochim Biophys Acta Gene Regul Mech. 2019 Apr;1862(4):486-492. doi: 10.1016/j.bbagrm.2019.02.002. Epub 2019 Feb 27. Biochim Biophys Acta Gene Regul Mech. 2019. PMID: 30825655 Free PMC article.
-
C/EBPβ (CEBPB) protein binding to the C/EBP|CRE DNA 8-mer TTGC|GTCA is inhibited by 5hmC and enhanced by 5mC, 5fC, and 5caC in the CG dinucleotide.Biochim Biophys Acta. 2015 Jun;1849(6):583-9. doi: 10.1016/j.bbagrm.2015.03.002. Epub 2015 Mar 13. Biochim Biophys Acta. 2015. PMID: 25779641 Free PMC article.
-
The Epstein-Barr Virus B-ZIP Protein Zta Recognizes Specific DNA Sequences Containing 5-Methylcytosine and 5-Hydroxymethylcytosine.Biochemistry. 2017 Nov 28;56(47):6200-6210. doi: 10.1021/acs.biochem.7b00741. Epub 2017 Nov 10. Biochemistry. 2017. PMID: 29072898 Free PMC article.
-
CG methylation.Epigenomics. 2012 Dec;4(6):655-63. doi: 10.2217/epi.12.55. Epigenomics. 2012. PMID: 23244310 Free PMC article. Review.
-
A common mode of recognition for methylated CpG.Trends Biochem Sci. 2013 Apr;38(4):177-83. doi: 10.1016/j.tibs.2012.12.005. Epub 2013 Jan 23. Trends Biochem Sci. 2013. PMID: 23352388 Free PMC article. Review.
Cited by
-
bZIP Dimers CREB1, ATF2, Zta, ATF3|cJun, and cFos|cJun Prefer to Bind to Some Double-Stranded DNA Sequences Containing 5-Formylcytosine and 5-Carboxylcytosine.Biochemistry. 2020 Sep 29;59(38):3529-3540. doi: 10.1021/acs.biochem.0c00475. Epub 2020 Sep 20. Biochemistry. 2020. PMID: 32902247 Free PMC article.
-
A Conformational Switch in the Zinc Finger Protein Kaiso Mediates Differential Readout of Specific and Methylated DNA Sequences.Biochemistry. 2020 May 26;59(20):1909-1926. doi: 10.1021/acs.biochem.0c00253. Epub 2020 May 12. Biochemistry. 2020. PMID: 32352758 Free PMC article.
-
Impact of cytosine methylation on DNA binding specificities of human transcription factors.Science. 2017 May 5;356(6337):eaaj2239. doi: 10.1126/science.aaj2239. Science. 2017. PMID: 28473536 Free PMC article.
-
The Genome in a Three-Dimensional Context: Deciphering the Contribution of Noncoding Mutations at Enhancers to Blood Cancer.Front Immunol. 2020 Oct 7;11:592087. doi: 10.3389/fimmu.2020.592087. eCollection 2020. Front Immunol. 2020. PMID: 33117405 Free PMC article. Review.
-
Transcription factors as readers and effectors of DNA methylation.Nat Rev Genet. 2016 Aug 1;17(9):551-65. doi: 10.1038/nrg.2016.83. Nat Rev Genet. 2016. PMID: 27479905 Free PMC article. Review.
References
-
- Adams CM 2007. Role of the transcription factor ATF4 in the anabolic actions of insulin and the anti-anabolic actions of glucocorticoids. J Biol Chem 282: 16744–16753 - PubMed
-
- Ahn K, Herman SB, Fahnoe DC 1998. Soluble human endothelin-converting enzyme-1: Expression, purification, and demonstration of pronounced pH sensitivity. Arch Biochem Biophys 359: 258–268 - PubMed
-
- Ameri K, Harris AL 2008. Activating transcription factor 4. Int J Biochem Cell Biol 40: 14–21 - PubMed
Publication types
MeSH terms
Substances
Associated data
- Actions
- Actions
Grants and funding
LinkOut - more resources
Full Text Sources
Other Literature Sources
Molecular Biology Databases
Miscellaneous
