. 2013 May 6;210(5):1021-33.
doi: 10.1084/jem.20121258.

Attenuating homologous recombination stimulates an AID-induced antileukemic effect

Affiliations

Attenuating homologous recombination stimulates an AID-induced antileukemic effect

Kristin R Lamont et al. J Exp Med. .

Abstract

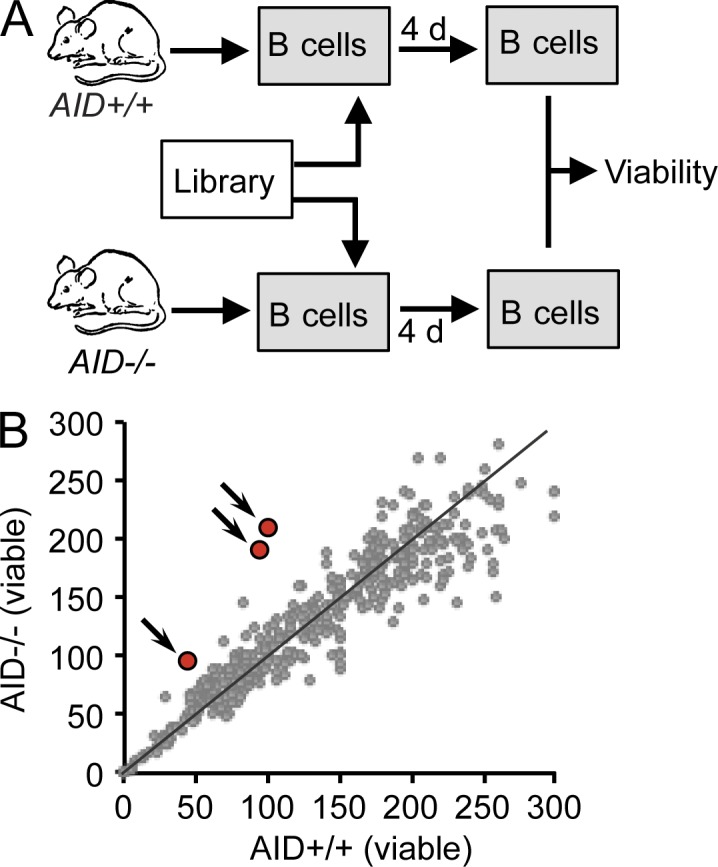
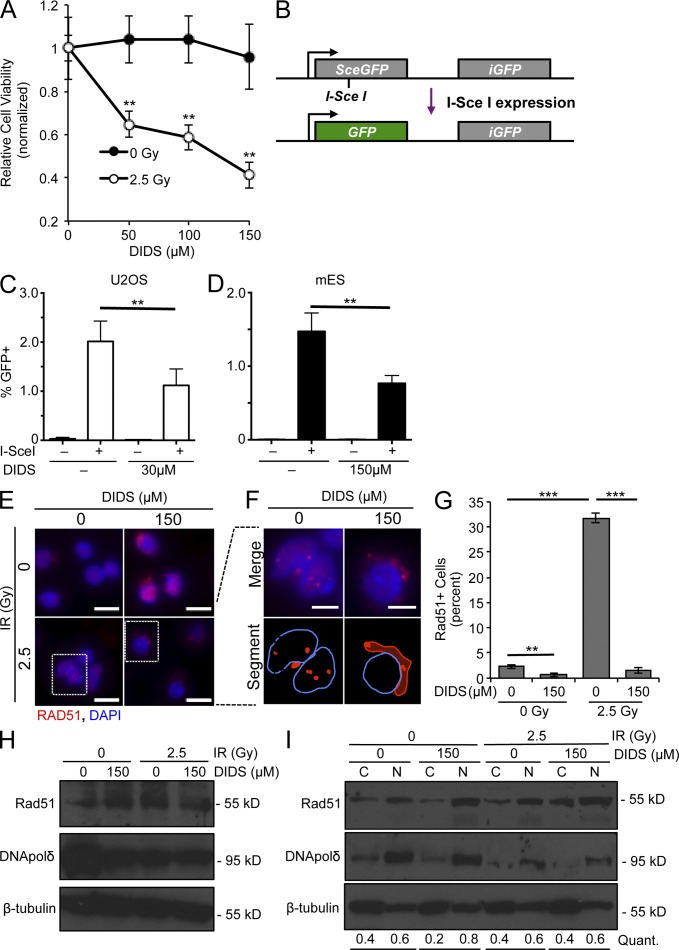
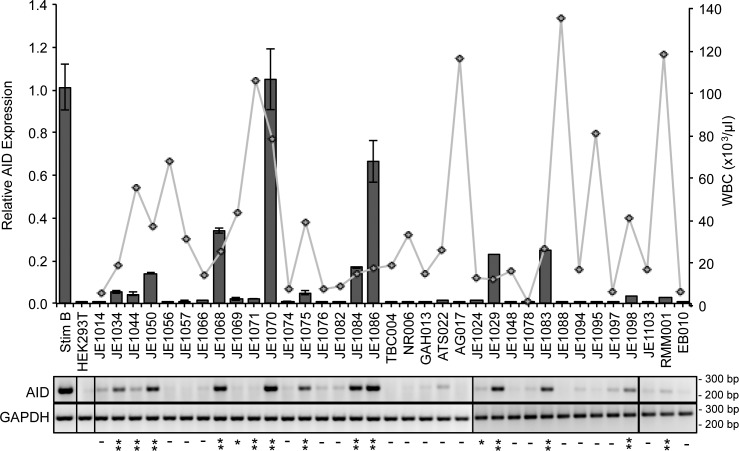
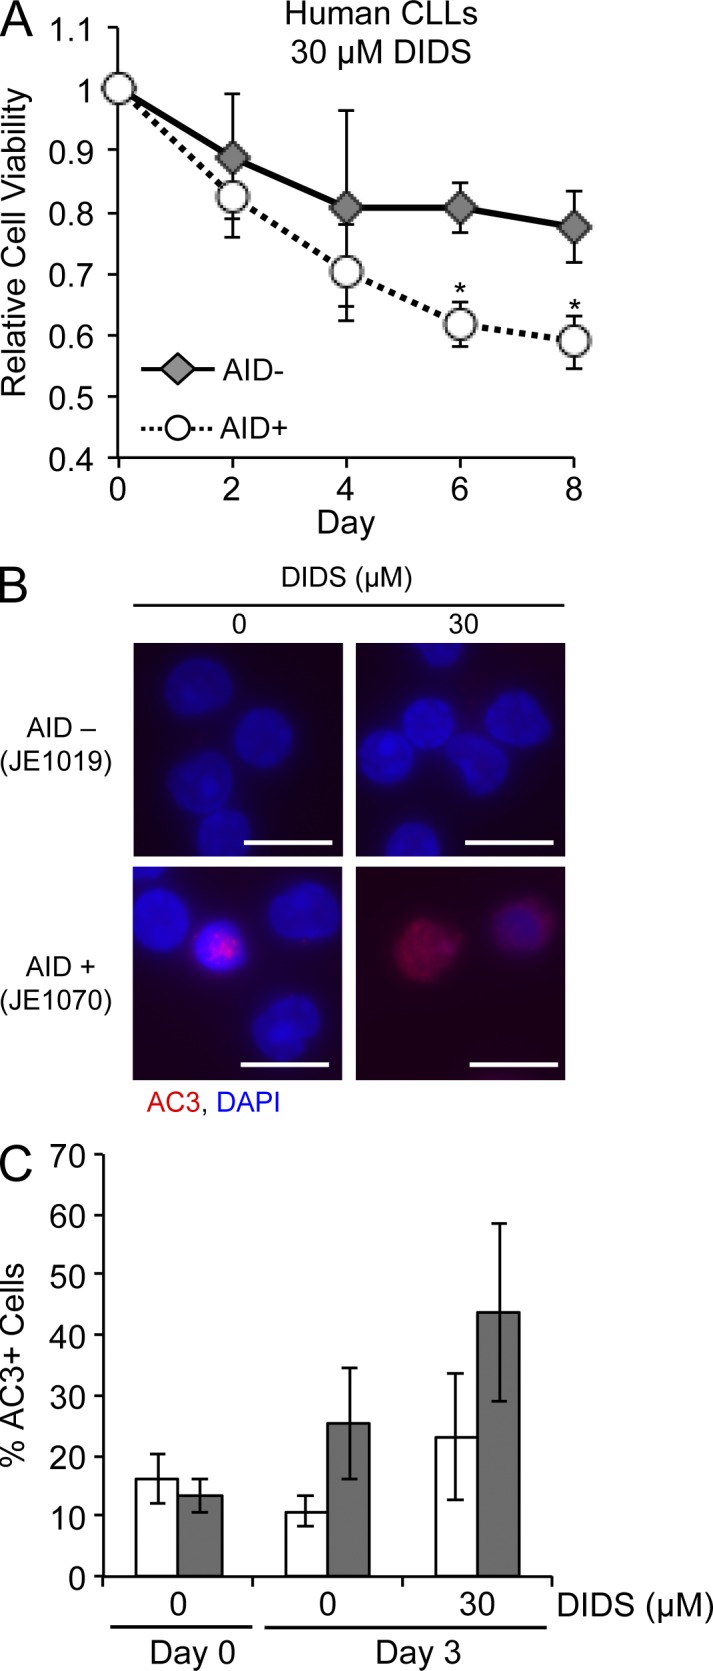
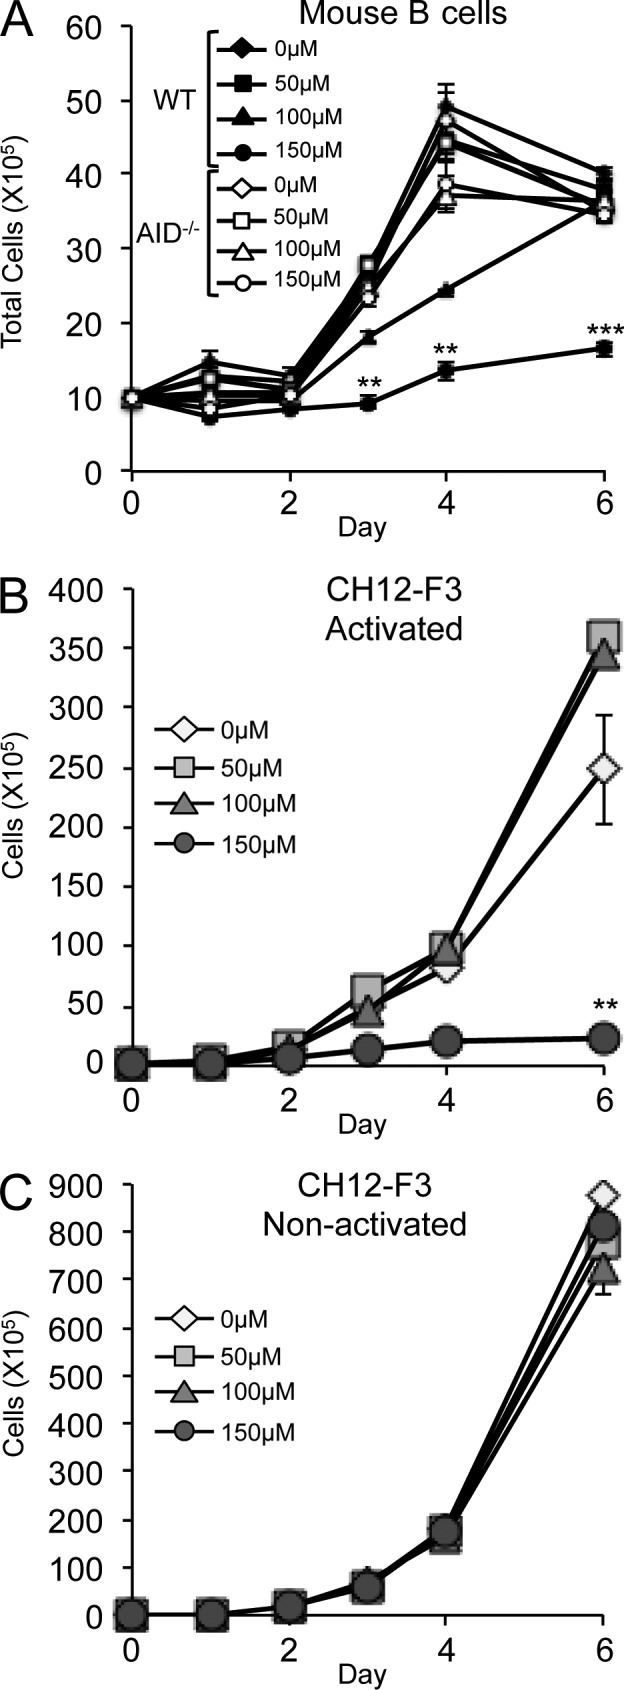
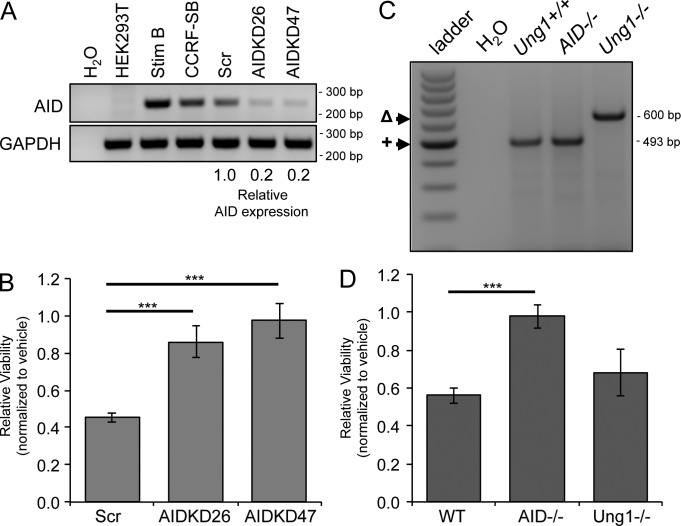
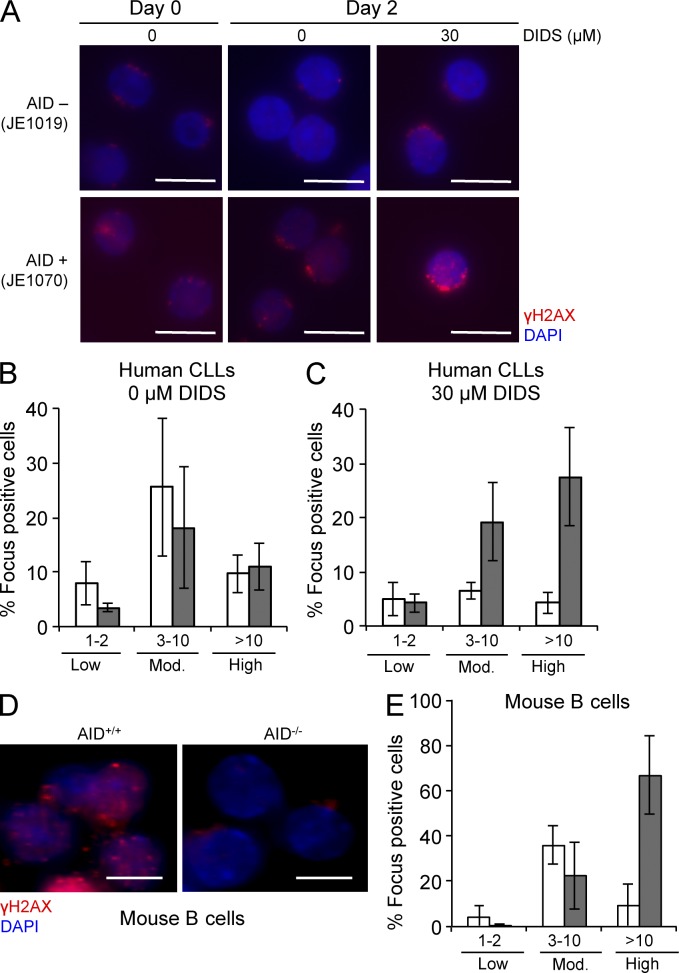
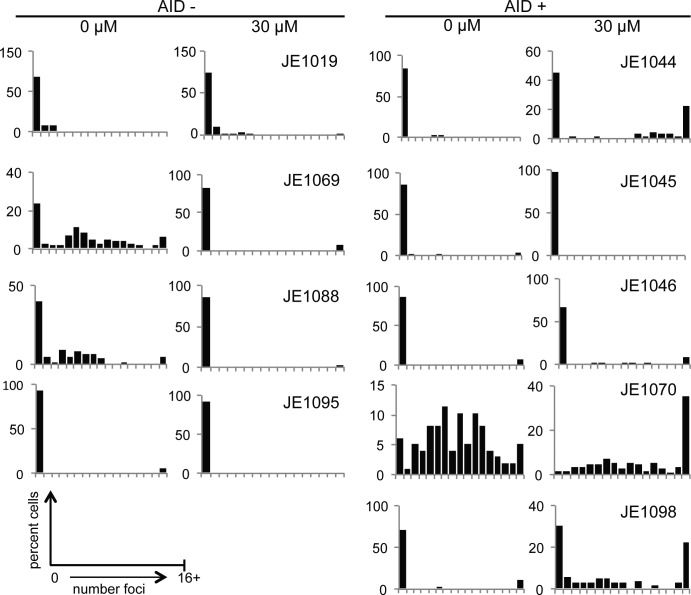
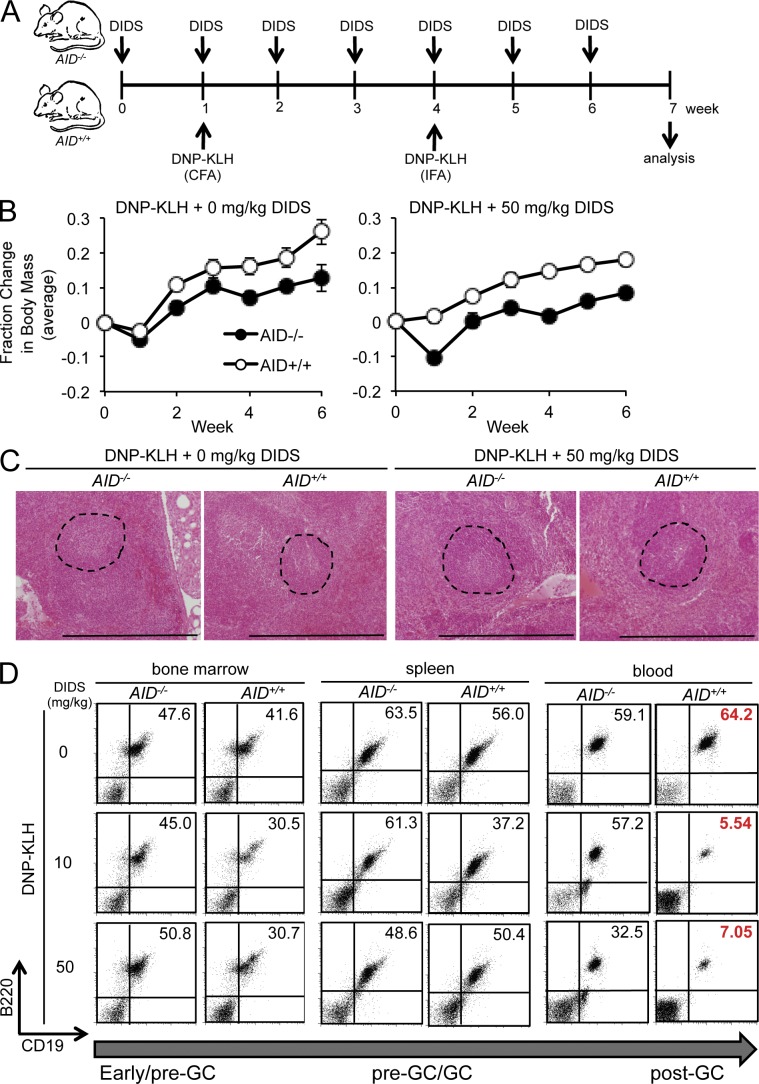
Activation-induced cytidine deaminase (AID) is critical in normal B cells to initiate somatic hypermutation and immunoglobulin class switch recombination. Accumulating evidence suggests that AID is also prooncogenic, inducing cancer-promoting mutations or chromosome rearrangements. In this context, we find that AID is expressed in >40% of primary human chronic lymphocytic leukemia (CLL) cases, consistent with other reports. Using a combination of human B lymphoid leukemia cells and mouse models, we now show that AID expression can be harnessed for antileukemic effect, after inhibition of the RAD51 homologous recombination (HR) factor with 4,4'-diisothiocyanatostilbene-2-2'-disulfonic acid (DIDS). As a proof of principle, we show that DIDS treatment inhibits repair of AID-initiated DNA breaks, induces apoptosis, and promotes cytotoxicity preferentially in AID-expressing human CLL. This reveals a novel antineoplastic role of AID that can be triggered by inhibition of HR, suggesting a potential new paradigm to treat AID-expressing tumors. Given the growing list of tumor types with aberrant AID expression, this novel therapeutic approach has potential to impact a significant patient population.


Figures

Figure 1.
Figure 1.
Compound screening for inhibitors of HR identifies DIDS as a candidate. (A) Schematic of compound screening for inhibitors of HR. In total, 470 compounds were screened from the NCI Diversity Set. (B) Differential plot showing compound screening data for AID+/+ versus AID−/− cells. Viable cell counts for AID−/− (y axis) versus AID+/+ (x axis) are plotted, with each data point representing an individual compound. Compounds to which AID−/− cells are more resistant than AID+/+ cells deviate vertically above the diagonal and are considered “hits.” Data points representing 150 µM DIDS are shown in red and denoted by arrows (three independent trials).
Figure 2.
Figure 2.
DIDS inhibits RAD51 complex formation and sensitizes cells to IR. (A) Viability analysis of CH12-F3 cells 24 h after exposure to either 0 or 2.5 Gy IR in the presence of the indicated concentrations of DIDS. Data are normalized to the fraction of cells for each IR dose that received 0 µM DIDS; error bars represent the SEM for three independent experiments. (B) Schematic of construct used for DR-GFP assay. (C and D) Analysis of HR in U2OS (C) and mES (D) cell lines containing the DR-GFP reporter electroporated with an I-SceI or control expression vector in the presence or absence of 30 µM and 150 µM DIDS, respectively. Data are from four independent experiments; error bars represent 1 SD. Statistical analysis was performed using a paired two-tail Student’s t test. (E) Immunofluorescence detection of RAD51 in primary mouse B cells 24 h after irradiation (0 or 2.5 Gy) with or without 150 µM DIDS. RAD51 staining is indicated in red, and nuclear DNA (DAPI stained) is shown in blue. (F) Magnification of cells in bottom panels of E. Manually segmented images (bottom) in which nuclear periphery and RAD51 localization in top images were drawn; blue outlines delineate nuclear periphery, and red outline indicates cytoplasmic RAD51 signal. Bars: (E) 10 µm; (F) 4.4 µm. (G) Quantification of cells that exhibit RAD51 signal in nucleus (RAD51+) from D and E. Error bars represent the SEM for three independent experiments. (H and I) Cell fractionation assay of primary mouse B cells irradiated and treated with DIDS as in E–G. Whole cell lysates (H) and cytoplasmic (C)/nuclear (N) fractions (I) were analyzed by Western blotting for RAD51, DNA polδ, and β-tubulin. Values below the panels on right represent the fraction of RAD51 in that compartment compared with RAD51 signal in C+N, determined by densitometry. Student’s t test p-values: ***, P < 0.001; **, P = 0.001–0.1.
Figure 3.
Figure 3.
AID is expressed in a significant fraction of primary CLL tumor specimens. Total RNA was prepared from PBMCs from 74 patients diagnosed with CLL and used in real-time qPCR (top) and RT-PCR analysis (bottom) of AID expression. Only the data for 35 patient samples are shown. Water (H2O) and embryonic kidney cells (HEK293T) cells were used as negative controls for template and AID expression, respectively, and human activated B lymphocytes (Stim B) were used as a positive control. GAPDH was used as a loading control. qPCR CT values for AID expression were normalized to GAPDH and then normalized to Stim B, whose expression was set at 1. Error bars represent the SEM of three independent analyses for each sample. Patient WBC values are also plotted, with axis on the right. Samples that do not express AID (within 3 SD of the negative control) are denoted by a dash (-); samples determined to express AID (between 3 and 5 SD of the negative control) are labeled with a single asterisk (*); strongly expressing samples (>5 SD of the negative control) are labeled with a double asterisk (**). Black lines indicate that intervening lanes were spliced out.
Figure 4.
Figure 4.
DIDS stimulates AID-dependent cytotoxicity in human CLL cells. (A) Viability of patient-derived CLL PBMCs cultured with 30 µM DIDS for up to 8 d. Viability was determined by counting of Trypan blue dye excluding cells via hemocytometer. DIDS-treated cells were normalized to untreated (0 µM DIDS) counterparts, and the plot represents the mean relative cell viability. Error bars represent the SEM for n = 4 tumors in each category. (B) Representative immunofluorescence microscopy images of AC3 staining in CD5+ CD19+ sorted CLL cells from an AID patient sample (JE1019) and an AID+ patient sample (JE1070). Cells were imaged on day 3 after treatment with or without 30 µM DIDS. Bars, 10 µm. (C) Percentage of AC3+ cells represented in B, counting ∼100 cells per treatment. Error bars represent the SEM for n = 4 and n = 5 tumors for AID (open bars) and AID+ (gray bars), respectively. Unpaired Student’s t test p-value: *, P = 0.01–0.05.
Figure 5.
Figure 5.
DIDS stimulates AID-dependent cytotoxicity in normal and malignant mouse B cells. (A) Measurement of cell proliferation of primary AID+/+ splenocytes, activated to induce CSR via α-CD40/IL-4 treatment on days 0 and 2, in the presence of the indicated concentrations of DIDS. Measurement of cell proliferation was determined by Trypan blue staining and counting of viable cells via hemocytometer. Data are represented as the mean cell count for each condition. (B and C) Proliferation of activated (B) or nonactivated (C) CH12-F3 cells after treatment with the indicated concentrations of DIDS. CH12-F3 cells in B were activated on day 0 and restimulated on day 2 with α-CD40, IL-4, and TGF-β. CH12-F3 cells in C were only administered α-CD40 on days 0 and 2. Viability was determined by Trypan blue exclusion test. (A–C) Error bars represent the SEM for three independent experiments. Unpaired Student’s t test p-values: ***, P < 0.001; **, P = 0.001–0.1.
Figure 6.
Figure 6.
AID is required to induce DIDS cytotoxicity in malignant B cells. (A) RT-PCR analysis of AID expression 72 h after shRNA transduction in CCRF-SB cells. Water (H2O) and RNA from human embryonic kidney cells (HEK293T) cells were used as negative controls for template and AID expression, respectively, and human activated B lymphocyte RNA (Stim B) was used as a positive control. GAPDH was used as a loading control. Values below images represent densitometry analysis and were normalized to GAPDH, and the expression of AID in Scr was set at 1. (B) Viability of shRNA-transduced CCRF-SB cells after treatment with 150 µM DIDS for 5 d. Viability was determined by Trypan blue staining and counting of cells via hemocytometer. Data are normalized to vehicle-treated (DMSO) cells in each transduction group. Error bars represent the SEM for n = 6 samples. (C) Genotyping reaction for Ung1 (UNG) knockdown from the spleen of the indicated mice. “+” denotes the expected PCR product size produced from the WT allele of Ung, whereas “Δ” denotes the expected size of the deleted Ung allele. (D) Viability assay of sorted B cells that were activated with α-CD40 and IL-4 and treated with either 150 µM DIDS or DMSO vehicle for 4 d. Data are normalized to DMSO-treated cells in each genotype. Error bars represent the SEM for n = 6 samples from each of two mice for WT and AID−/− and n = 3 samples for Ung1−/−. Unpaired Student’s t test p-values: ***, P < 0.001.
Figure 7.
Figure 7.
DIDS prevents repair of AID-induced DNA DSBs in malignant and nontransformed B cells. (A) Representative immunofluorescence images of phosphorylated γ-H2AX in purified CD5+ CD19+ CLL cells from an AID (JE1019) and an AID+ (JE1070) patient sample. Cells were treated for 0–2 d with or without 30 µM DIDS. (B and C) Quantitation of foci observed in CLL cells after 2 d of culture in the absence (B) or presence (C) of 30 µM DIDS. Data were grouped into binds of cells with low (1–2 foci per nucleus), moderate (3–10 foci per nucleus), or high (>10 foci per nucleus) DNA damage. Error bars represent the SEM for n = 4 and n = 5 tumors for AID (open bars) and AID+ (gray bars), respectively. (D) Representative immunofluorescence microscopy images of phosphorylated γ-H2AX foci in activated mouse splenic B cells after 3 d in the presence of 150 µM DIDS. (E) Percentage of AID+/+ (gray bars) or AID−/− (open bars) cells with low (1–2 foci per nucleus), moderate (3–10 foci per nucleus), or high (>10 foci per nucleus) DNA damage. Error bars represent the SEM for n = 4 (AID CLLs), n = 5 (AID+ CLLs), and n = 3 (AID−/−, AID+/+ mouse B cells) experiments. Bars, 10 µm.
Figure 8.
Figure 8.
γ-H2AX foci distributions for CLLs cultured with 30 µM DIDS. CD5+ CD19+ sorted cells from primary CLL patient PBMC samples were cultured in media with 0 or 30 µM DIDS for 2 d before fixation on coverslips and immunostaining for phosphorylated γ-H2AX. Approximately 100 cells were counted for each sample. Foci distributions for AID CLLs (left) and AID+ CLLs (right) are represented as the percentage of cells (y axis) with the number of γ-H2AX foci plotted on the x axis. CLL tumor IDs are provided next to their individual distributions.
Figure 9.
Figure 9.
DIDS-induced ablation of circulating B lymphocytes in vivo requires AID. (A) Schematic of experimental design to examine the effect of systemic DIDS treatment in a primary mouse model. 8-wk-old AID−/− and AID+/+ mice were injected intraperitoneally with 0, 10, or 50 mg/kg DIDS weekly (n = 5 mice in each group). To activate AID, mice were immunized with DNP-KLH (with CFA) after 1 wk and given a booster treatment with DNP-KLH (with incomplete Freund’s adjuvant [IFA]) after 4 wk. Mice were euthanized after 7 wk and analyzed. (B) Fraction change in body mass of mice treated with DNP-KLH and either 0 mg/kg (left) or 50 mg/kg (right) DIDS. Data represent the mean fractional change in body mass for five animals; error bars denote SEM. (C) H&E staining of AID+/+ and AID−/− spleens at necropsy. GCs are outlined by superimposed dashed lines. Bars, 500 µm. (D) Endpoint flow cytometry dot plot analysis of bone marrow, spleen, and peripheral blood from AID−/− and AID+/+ mice immunized with DNP-KLH and treated with 0, 10, or 50 mg/kg DIDS. Plots represent the population of cells in the lymphocyte gate stained for expression of B220 (y axis) and CD19 (x axis). The numbers in top right corner of each plot provide the percentage of B220+ CD19+ cells for each analysis. The progression of B cell maturation from early/pre-GC to post-GC is indicated below.

Similar articles

Cited by

References

    1. Ashworth A. 2008. A synthetic lethal therapeutic approach: poly(ADP) ribose polymerase inhibitors for the treatment of cancers deficient in DNA double-strand break repair. J. Clin. Oncol. 26:3785–3790 10.1200/JCO.2008.16.0812 - DOI - PubMed
    1. Begum N.A., Izumi N., Nishikori M., Nagaoka H., Shinkura R., Honjo T. 2007. Requirement of non-canonical activity of uracil DNA glycosylase for class switch recombination. J. Biol. Chem. 282:731–742 10.1074/jbc.M607439200 - DOI - PubMed
    1. Caddle L.B., Hasham M.G., Schott W.H., Shirley B.-J., Mills K.D. 2008. Homologous recombination is necessary for normal lymphocyte development. Mol. Cell. Biol. 28:2295–2303 10.1128/MCB.02139-07 - DOI - PMC - PubMed
    1. Chaudhuri J., Tian M., Khuong C., Chua K., Pinaud E., Alt F.W. 2003. Transcription-targeted DNA deamination by the AID antibody diversification enzyme. Nature. 422:726–730 10.1038/nature01574 - DOI - PubMed
    1. Cheson B.D., Vena D.A., Barrett J., Freidlin B. 1999. Second malignancies as a consequence of nucleoside analog therapy for chronic lymphoid leukemias. J. Clin. Oncol. 17:2454–2460 - PubMed

MeSH terms

Substances