. 2013 Apr 15;201(2):325-35.
doi: 10.1083/jcb.201211097.

Identifying gene locus associations with promyelocytic leukemia nuclear bodies using immuno-TRAP

Affiliations

Identifying gene locus associations with promyelocytic leukemia nuclear bodies using immuno-TRAP

Reagan W Ching et al. J Cell Biol. .

Abstract

Important insights into nuclear function would arise if gene loci physically interacting with particular subnuclear domains could be readily identified. Immunofluorescence microscopy combined with fluorescence in situ hybridization (immuno-FISH), the method that would typically be used in such a study, is limited by spatial resolution and requires prior assumptions for selecting genes to probe. Our new technique, immuno-TRAP, overcomes these limitations. Using promyelocytic leukemia nuclear bodies (PML NBs) as a model, we used immuno-TRAP to determine if specific genes localize within molecular dimensions with these bodies. Although we confirmed a TP53 gene-PML NB association, immuno-TRAP allowed us to uncover novel locus-PML NB associations, including the ABCA7 and TFF1 loci and, most surprisingly, the PML locus itself. These associations were cell type specific and reflected the cell's physiological state. Combined with microarrays or deep sequencing, immuno-TRAP provides powerful opportunities for identifying gene locus associations with potentially any nuclear subcompartment.


Figures

Figure 1.
Figure 1.
Affinity purification of PML NB–associated chromatin using immuno-TRAP. (A) Schematic of the immuno-TRAP protocol. (1) Cells are placed or grown on glass slides. (2) Cells are then fixed and permeabilized for immunolabeling for PML protein using a primary antibody against PML (blue) and a secondary antibody conjugated with HRP (red). Biotinylated tyramide (orange) and hydrogen peroxide are added to the samples and tyramide deposition occurs at PML NBs and the surrounding chromosome territories (CT). (3) Cells are collected and the DNA sheared and affinity purified on a streptavidin-agarose column. (B) Verification of the tyramide deposition. Jurkat cells were prepared for immuno-TRAP and treated with anti-PML (+Ab) and control anti-FLAG (−Ab) antibodies. Tyramide-biotin was detected with streptavidin-Cy3. Tyramide-biotin labeling occurred predominantly around PML NBs, visualized by immunofluorescence microscopy with an anti-PML antibody. Images shown are single optical planes from a z stack. Bar, 5 µm. (C) DNA gel electrophoresis was performed on three samples: sheared genomic Jurkat DNA (lane 1), immuno-TRAP isolated Jurkat DNA using a control anti-FLAG (lane 2), and using an anti-PML antibody (lane 3). Significantly more DNA was isolated when a PML-specific antibody was used compared with the control (compare lanes 2 and 3). (D) DNA dot blot analysis was performed to determine which regions within Chr17p13.2-13.1 were enriched at PML NBs. See Table S1 for the BACs used. The affinity-purified DNA (AP) and a PCR product against the CAT gene (CAT), used as a normalization standard, were radiolabeled and used to probe the membranes. Values plotted on the graph are relative to the BCL2 locus (a putative nonassociated locus). Three regions (red circles) near the TP53 locus were more enriched than the BAC containing the TP53 locus itself (arrow). (E) Bar graph comparing the enrichment of the PML locus relative to the BCL2 locus and the three highest hits from chromosome 17, measured from the DNA dot blot. Error bars in graphs (D and E) represent the standard deviation of three independent sample preparations. Paired t tests confirmed that the peaks were significantly enriched over BCL2 (*, P < 0.02; **, P < 0.01). (F) DNA dot blot analysis was performed to determine the resolution capabilities of immuno-TRAP. Six FOSMIDs spanning peak 2, the BCL2 BAC, and the BACs flanking and containing peak2 were spotted on a membrane (see Table S1 for FOSMIDs used). Probing and normalization was performed similarly as in D. Values plotted are relative to the BCL2 locus. Paired t tests indicated that FOSMID pairs 1 and 4, and 4 and 5 are significantly different (*, P < 0.05; **, P < 0.10, respectively).
Figure 2.
Figure 2.
Confirmation of loci enrichment at PML NBs with immuno-FISH. (A–E) Jurkat cells were probed with the three BACs from Chr 17p13.2-13.1 that gave the highest dot blot signals (Fig. 1, D and E; red) and immunolabeled for PML NBs (green). (F) mmd measurements were obtained from the immuno-FISH images. In the box plots, the box represents the second and third quartiles, the whiskers represent the minimum and maximum values, the middle line represents the median, and an “X” denotes the mean. The three enriched regions found in this study and the PML locus were all significantly more associated with PML NBs than the BCL2 locus (P < 0.0001). (G–I) Dual-color immuno-FISH was performed where Jurkat cells were probed against peaks 1 and 2 (Fig. 1, D and E; red and green, respectively) simultaneously and immunolabeled for PML protein (cyan). The following loci arrangements were observed: (G) peak 1 is closer to the PML NB than peak 2 in 43.9% of the measurements, (H) peak 2 is closer to a PML NB than peak 1 in 30.6% of the measurements, and (I) both peaks were approximately equidistance from the PML NB. Images shown are single optical planes from a z stack. Broken lines outline cell nuclei. Bars, 5 µm.
Figure 3.
Figure 3.
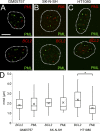
Cell type specificity of PML NB loci associations. (A–C) Immuno-FISH was performed on GM05757, SK-N-SH, and HT1080 cells to determine if the PML locus association with PML NBs is cell type specific. Cells were probed for the PML and BCL2 loci (red) and PML NBs (green). Broken lines outline cell nuclei. Bar, 5 µm. (D) Box plots comparing BCL2 and PML mmd measurements. The asterisk denotes a significant association (P < 0.001) between the PML locus and PML NBs observed in HT1080 cells. Elements in the box plots are defined the same as in Fig. 2 F. Images shown are single optical planes from a z stack.
Figure 4.
Figure 4.
Creating new locus–PML NBs associations. (A) GM0575 cells were treated with IFN-α for 24 h. Protein samples were prepared and Western blots were performed showing that PML protein levels increase after IFN-α. (Multiple bands correspond to various splice isoforms of PML and posttranslational modifications, i.e., sumoylation.) (B) Immunofluorescence for PML NBs was performed on GM05757 cells, and the number of PML NBs was determined. The bar graph shows that PML NBs increased in number after IFN-α treatment. (C) Immuno-FISH was performed on GM05757 cells treated with IFN-α and probed for either the PML or BCL2 locus (red) and with an antibody against PML to detect PML NBs (green). Box plots show that the PML locus was significantly more associated than the BCL2 locus after IFN-α treatment in GM05757 cells (*, P < 0.0001). Elements in the box plots are defined the same as in Fig. 2 F. Broken lines outline cell nuclei. Bar, 5 µm. (D) DNA dot blot analysis was performed on DNA (AP) isolated from IFN-α–treated GM05757 cells with immuno-TRAP and probed for enrichment against BACs corresponding to BCL2 and five BACs surrounding and including the PML locus (see Table S1 for a list of BACs). The CAT gene (CAT) was used as a normalization standard. The bar graph shows relative enrichment for each BAC relative to the BCL2 locus. This experiment was performed using three biological replicates and the error bars represent the standard deviation. Images shown are single optical planes from a z stack.
Figure 5.
Figure 5.
Promoter analysis and confirmation. 11 loci were chosen and tested by immuno-FISH for possible association with PML NBs. These loci were chosen based on significance of the enrichment (low q-values) and on their having been previously FISH-mapped on the human genome. The table on the left shows the mmd averages and standard deviations between the locus of interest and PML NBs. The percent association is also shown. The mmd values were then compared with the BCL2 and PML loci. The asterisks denote values that are significantly different than BCL2mmd but similar to PMLmmd values (P < 0.001). Representative immuno-FISH of four loci (red) are shown (right) that demonstrate significant associations with PML NBs (green). Images are derived from single optical planes from a z stack. Broken lines outline cell nuclei. Bar, 5 µm.

Similar articles

Cited by

References

    1. Bloch D.B., Chiche J.D., Orth D., de la Monte S.M., Rosenzweig A., Bloch K.D. 1999. Structural and functional heterogeneity of nuclear bodies. Mol. Cell. Biol. 19:4423–4430 - PMC - PubMed
    1. Block G.J., Eskiw C.H., Dellaire G., Bazett-Jones D.P. 2006. Transcriptional regulation is affected by subnuclear targeting of reporter plasmids to PML nuclear bodies. Mol. Cell. Biol. 26:8814–8825 10.1128/MCB.00636-06 - DOI - PMC - PubMed
    1. Boisvert F.M., Hendzel M.J., Bazett-Jones D.P. 2000. Promyelocytic leukemia (PML) nuclear bodies are protein structures that do not accumulate RNA. J. Cell Biol. 148:283–292 10.1083/jcb.148.2.283 - DOI - PMC - PubMed
    1. Broccardo C., Osorio J., Luciani M.F., Schriml L.M., Prades C., Shulenin S., Arnould I., Naudin L., Lafargue C., Rosier M., et al. 2001. Comparative analysis of the promoter structure and genomic organization of the human and mouse ABCA7 gene encoding a novel ABCA transporter. Cytogenet. Cell Genet. 92:264–270 10.1159/000056914 - DOI - PubMed
    1. Cao T., Duprez E., Borden K.L., Freemont P.S., Etkin L.D. 1998. Ret finger protein is a normal component of PML nuclear bodies and interacts directly with PML. J. Cell Sci. 111:1319–1329 - PubMed

Publication types

MeSH terms

Associated data