

Notch1 signaling is involved in regulating Foxp3 expression in T-ALL
- PMID: 23578365
- PMCID: PMC3663738
- DOI: 10.1186/1475-2867-13-34
Notch1 signaling is involved in regulating Foxp3 expression in T-ALL
Abstract
Background: T-cell acute lymphoblastic leukemia (T-ALL) is a highly aggressive hematologic malignancy. Immune tolerance induced by CD4+CD25+ regulatory T cells (Tregs) with high expression of Foxp3 is an important hypothesis for poor therapy response. Notch1 signaling is thought to be involved in the pathogenesis of this disease. Crosstalk between Notch and Foxp3+Tregs induced immune tolerance is unknown in T-ALL. We studied Foxp3 and Notch1 expression in vivo and in vitro, and analyzed the biological characteristics of T-ALL cell line systematically after Notch inhibition and explored the crosstalk between Notch signaling and Foxp3 expression.
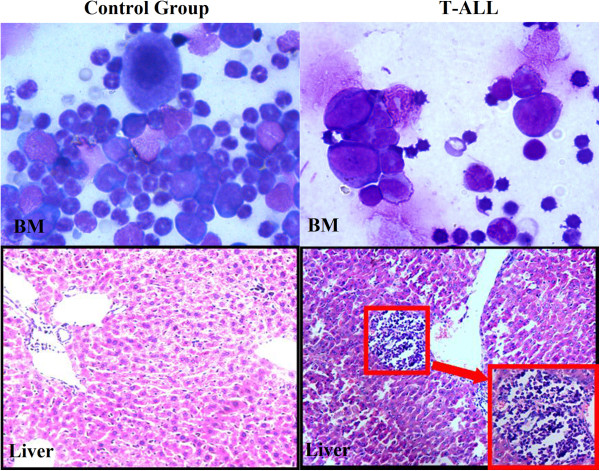
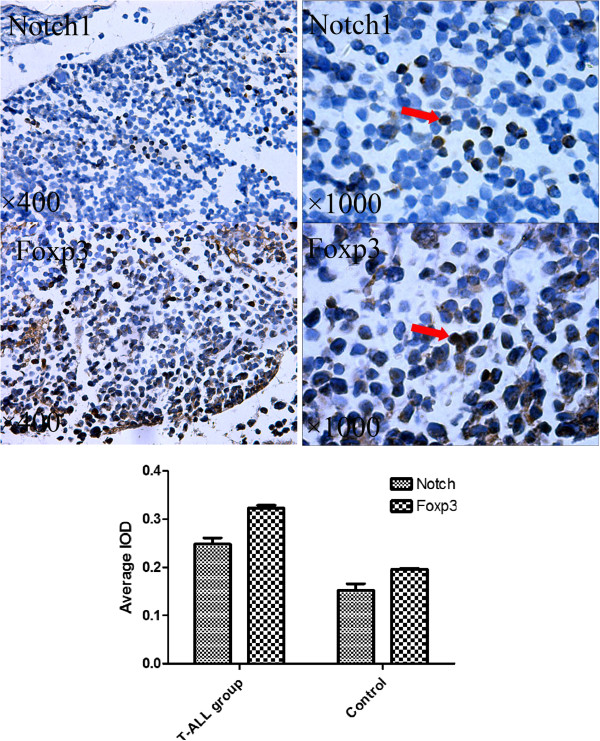
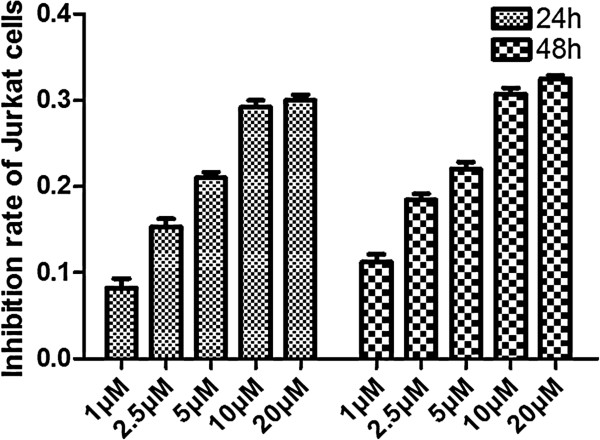
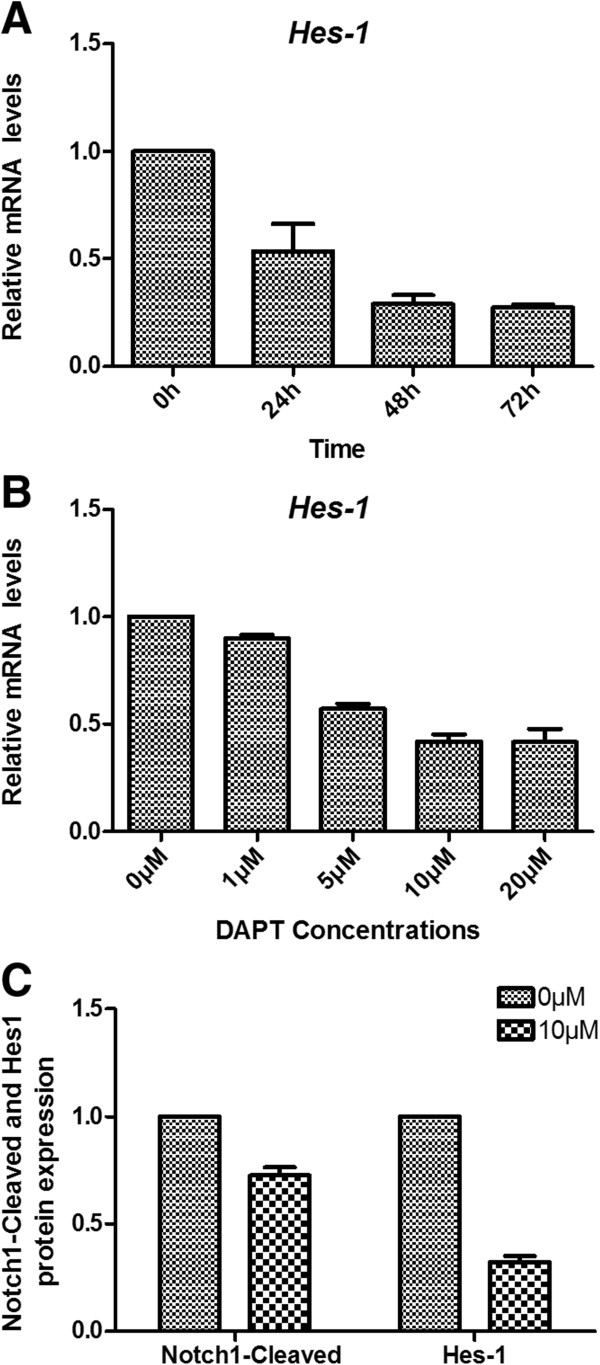
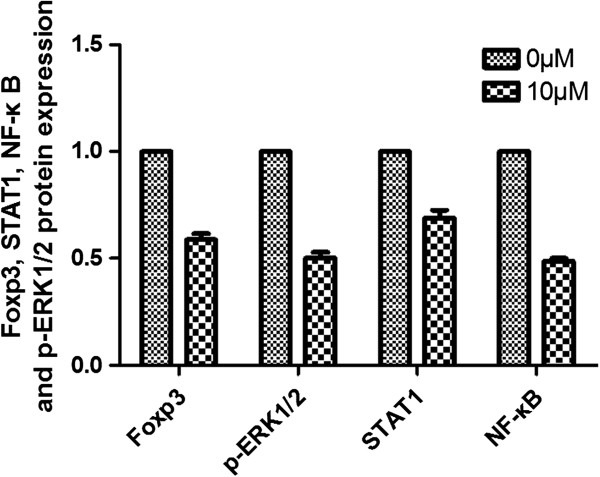
Methods: In vivo, we established T-ALL murine model by Jurkat cells transplantation to severe combined immunodeficiency (SCID) mice. Notch1 and Foxp3 expression was detected. In vitro, we used γ-secretase inhibitor N-S-phenyl-glycine-t-butyl ester (DAPT) to block Notch1 signaling in Jurkat cells. Notch1, Hes-1 and Foxp3 genes and protein expression were detected by PCR and western blotting, respectively. The proliferation pattern, cell cycle and viability of Jurkat cells after DAPT treatment were studied. Protein expression of Notch1 target genes including NF-κB, p-ERK1/2 and STAT1 were determined.
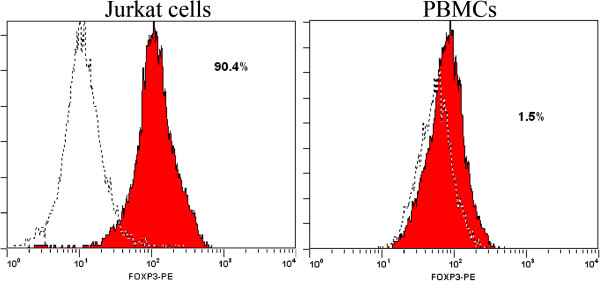
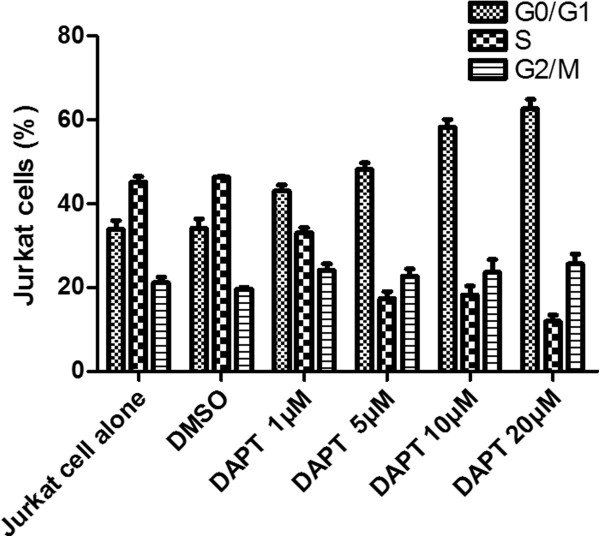
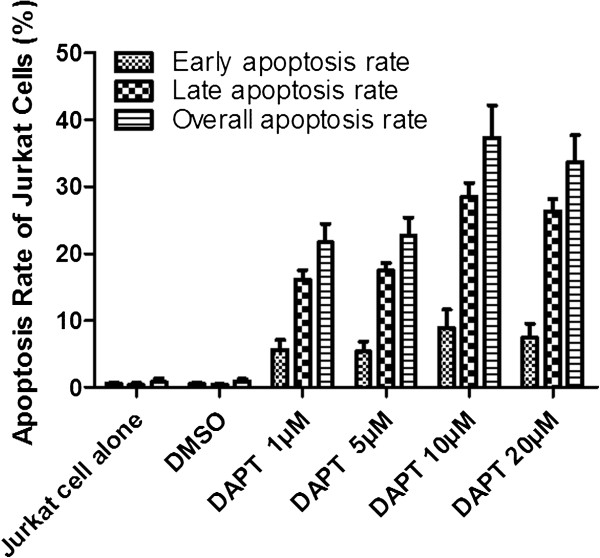
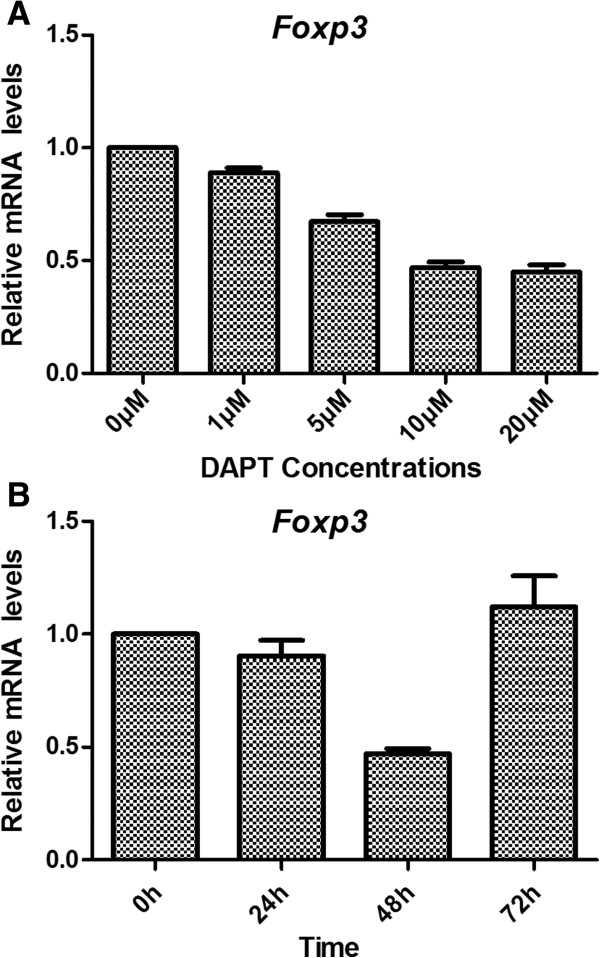
Results: We show that engraftment of Jurkat cells in SCID mice occurred in 8 of 10 samples (80%), producing disseminated human neoplastic lymphocytes in PB, bone marrow or infiltrated organs. Notch1 and Foxp3 expression were higher in T-ALL mice than normal mice. In vitro, Jurkat cells expressed Notch1 and more Foxp3 than normal peripheral blood mononuclear cells (PBMCs) in both mRNA and protein levels. Blocking Notch1 signal by DAPT inhibited the proliferation of Jurkat cells and induced G0/G1 phase cell cycle arrest and apoptosis. Foxp3 as well as p-ERK1/2, STAT1 and NF-κB expression was down regulated after DAPT treatment.
Conclusions: These findings indicate that regulation of Foxp3 expression does involve Notch signaling, and they may cooperatively regulate T cell proliferation in T-ALL.
Figures

Similar articles
-
FOXP3 knockdown inhibits the proliferation and reduces NOTCH1 expression of T cell acute lymphoblastic leukemia cells.BMC Res Notes. 2018 Aug 13;11(1):582. doi: 10.1186/s13104-018-3700-3. BMC Res Notes. 2018. PMID: 30103821 Free PMC article.
-
Effect of γ-secretase inhibitor on Th17 cell differentiation and function of mouse psoriasis-like skin inflammation.J Transl Med. 2018 Mar 10;16(1):59. doi: 10.1186/s12967-018-1442-6. J Transl Med. 2018. PMID: 29523162 Free PMC article.
-
Notch1 and TGFbeta1 cooperatively regulate Foxp3 expression and the maintenance of peripheral regulatory T cells.Blood. 2008 Sep 1;112(5):1813-21. doi: 10.1182/blood-2008-03-144980. Epub 2008 Jun 11. Blood. 2008. PMID: 18550850 Free PMC article.
-
T cell acute lymphoblastic leukemia/lymphoma: a human cancer commonly associated with aberrant NOTCH1 signaling.Curr Opin Hematol. 2004 Nov;11(6):426-33. doi: 10.1097/01.moh.0000143965.90813.70. Curr Opin Hematol. 2004. PMID: 15548998 Review.
-
New insights into Notch1 regulation of the PI3K-AKT-mTOR1 signaling axis: targeted therapy of γ-secretase inhibitor resistant T-cell acute lymphoblastic leukemia.Cell Signal. 2014 Jan;26(1):149-61. doi: 10.1016/j.cellsig.2013.09.021. Epub 2013 Oct 16. Cell Signal. 2014. PMID: 24140475 Review.
Cited by
-
Notch and NF-κB: Coach and Players of Regulatory T-Cell Response in Cancer.Front Immunol. 2018 Oct 11;9:2165. doi: 10.3389/fimmu.2018.02165. eCollection 2018. Front Immunol. 2018. PMID: 30364244 Free PMC article. Review.
-
FOXP3-regulated lncRNA NONHSAT136151 promotes colorectal cancer progression by disrupting QKI interaction with target mRNAs.J Cell Mol Med. 2024 Jan;28(2):e18068. doi: 10.1111/jcmm.18068. Epub 2023 Dec 2. J Cell Mol Med. 2024. PMID: 38041531 Free PMC article.
-
Prognostic value of Th17 cells in acute leukemia.Med Oncol. 2013 Dec;30(4):732. doi: 10.1007/s12032-013-0732-3. Epub 2013 Oct 2. Med Oncol. 2013. PMID: 24085544 Free PMC article.
-
Folic acid deficiency enhanced microglial immune response via the Notch1/nuclear factor kappa B p65 pathway in hippocampus following rat brain I/R injury and BV2 cells.J Cell Mol Med. 2019 Jul;23(7):4795-4807. doi: 10.1111/jcmm.14368. Epub 2019 May 13. J Cell Mol Med. 2019. PMID: 31087489 Free PMC article.
-
Conversion of glioma cells into neuron-like cells by small molecules.iScience. 2024 Oct 2;27(11):111091. doi: 10.1016/j.isci.2024.111091. eCollection 2024 Nov 15. iScience. 2024. PMID: 39483145 Free PMC article.
References
-
- Trioche P, Nelken B, Michel G, Pellier I, Petit A, Bertrand Y, Rohrlich P, Schmitt C, Sirvent N, Boutard P, Margueritte G, Pautard B, Ducassou S, Plantaz D, Robert A, Thomas C, Desseaux K, Chevret S, Baruchel A. French “real life” experience of clofarabine in children with refractory or relapsed acute lymphoblastic leukaemia. Exp Hematol Oncol. 2012;1:39. doi: 10.1186/2162-3619-1-39. - DOI - PMC - PubMed
LinkOut - more resources
Full Text Sources
Other Literature Sources
Research Materials
Miscellaneous
