. 2013 May 6;210(5):933-49.
doi: 10.1084/jem.20121437. Epub 2013 Apr 8.

MHC II tetramers visualize human CD4+ T cell responses to Epstein-Barr virus infection and demonstrate atypical kinetics of the nuclear antigen EBNA1 response

Affiliations

MHC II tetramers visualize human CD4+ T cell responses to Epstein-Barr virus infection and demonstrate atypical kinetics of the nuclear antigen EBNA1 response

Heather M Long et al. J Exp Med. .

Abstract

Virus-specific CD4(+) T cells are key orchestrators of host responses to viral infection yet, compared with their CD8(+) T cell counterparts, remain poorly characterized at the single cell level. Here we use nine MHC II-epitope peptide tetramers to visualize human CD4(+) T cell responses to Epstein-Barr virus (EBV), the causative agent of infectious mononucleosis (IM), a disease associated with large virus-specific CD8(+) T cell responses. We find that, while not approaching virus-specific CD8(+) T cell expansions in magnitude, activated CD4(+) T cells specific for epitopes in the latent antigen EBNA2 and four lytic cycle antigens are detected at high frequencies in acute IM blood. They then fall rapidly to values typical of life-long virus carriage where most tetramer-positive cells display conventional memory markers but some, unexpectedly, revert to a naive-like phenotype. In contrast CD4(+) T cell responses to EBNA1 epitopes are greatly delayed in IM patients, in line with the well-known but hitherto unexplained delay in EBNA1 IgG antibody responses. We present evidence from an in vitro system that may explain these unusual kinetics. Unlike other EBNAs and lytic cycle proteins, EBNA1 is not naturally released from EBV-infected cells as a source of antigen for CD4(+) T cell priming.


Figures
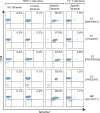
Figure 1.
Figure 1.
Specificity of EBV-specific MHC II tetramers. Epitope-specific CD4+ T cell clones were either unmanipulated or exposed to PE-conjugated MHC II tetramers of irrelevant or relevant MHC II–peptide combination. (right column) Epitope-specific CD4+ T cell clones were added at 1% to a nonspecific CD4+ T cell clone, and the mixture was stained with MHC II tetramer followed by anti-CD4. Values refer to the percentage of cells that stained with both CD4+ and tetramer (top right quadrant). Results are representative of three independent experiments.
Figure 2.
Figure 2.
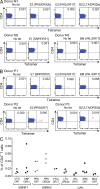
Frequency of EBV MHC II tetramer-specific cells in healthy long-term EBV carriers. CD8+ T cell–depleted PBMCs from EBV-seronegative donors N1-N3 (A) and EBV-seropositive donors P1-P3 (B) tested with EBV MHC II tetramers appropriate for their individual MHC types and with no tetramer as a control. Values in the top right quadrants refer to the percentage of total CD4+ T cells that stained with the tetramer in each case. Results are representative of 5 EBV-seronegative donors and 10 EBV-seropositive donors. (C) Summary of percentage frequencies of MHC II tetramer-positive CD4+ T cells in 10 healthy long-term EBV carriers with no history of IM. Unpaired Student’s t test with Welch’s correction was performed in GraphPad Prism 5.
Figure 3.
Figure 3.
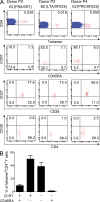
Phenotype of EBV MHC II tetramer-specific CD4 memory populations. (A) Analysis of EBV epitope-specific CD4+ T cells from three EBV seropositive donors stained with relevant MHC II tetramers, followed by anti-CD4 and indicated cell surface phenotyping antibodies. The top profiles show the percentages of CD4+ T cells that stained with the relevant tetramer in each case. The bottom three profiles show the percentages of epitope-specific CD4+ T cells staining for the markers in question, gated on the CD4+ Tetramer+ T cells in the upper profile. Results are representative of tetramer-staining populations from 10 individual donors. (B) Summary of percentage CCR7 and CD45RA expression on 28 MHC II tetramer-staining populations of all relevant specificities from 10 healthy EBV seropositive donors. The graph shows the mean values with SEM.
Figure 4.
Figure 4.
Expansion of EBV MHC II tetramer-specific CD4+ T cells during acute IM. Analysis of CD8+ T cell–depleted PBMCs from donors IM188, IM222, and IM232 that were cryopreserved during the acute phase of IM. Cells were stained with individual tetramers relevant for each patient’s MHC II type, or with no tetramer, followed by anti-CD4. Values in the top right quadrants refer to the percentage of total CD4+ T cells that stained with the tetramer in each case. The results shown are representative of experiments performed on 21 acute IM donors. Note that corresponding ELISpot assays of IFN-γ release (Long et al., 2005) gave the following frequencies of spot forming cells per 106 CD8+ T cell–depleted PBMCs in response to epitope peptide: IM188, 539 against PRS, 295 against PAQ, 40 against LTA, and 59 against VKL; IM232, 848 against PRS and 76 against PAQ (SRD and MLG not tested).
Figure 5.
Figure 5.
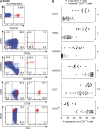
CD4+ T cell expansions in acute IM have an activated phenotype. (A) Analysis of E2 [PRS/DR7]-specific CD4+ T cells in CD8+ T cell–depleted PBMCs from donor IM260 that were cryopreserved during acute IM. The percentage of total CD4+ T cells that bound the tetramer is shown in the top profile. The bottom four rows show the percentages of cells staining for the stated markers within the total CD4+ T cell population (left hand column) and within the tetramer+ CD4+ T cells (right hand column). Non-tetramer+ CD4+ T cells are shown in blue and tetramer+ CD4+ T cells are shown in red. The results shown are representative of assays performed on 12 acute IM donors. (B) Summary of percentage expression of cell surface phenotypic, homing, and activation markers on total CD4+ T cells in 12 acute IM donors (filled circles) and on 29 EBNA2 and lytic antigen MHC II tetramer-specific populations of appropriate MHC II restriction in those donors (open circles). Unpaired Student’s t tests with Welch’s correction comparing marker expression between total CD4+ T cells and tetramer positive cells were performed in GraphPad Prism 5; *, P < 0.0001, **, P < 0.001.
Figure 6.
Figure 6.
Kinetics of EBV MHC II tetramer-specific CD4+ T cell responses during IM PBMCs cryopreserved from. (A) Donor IM248 and (B) Donor IM260 during acute IM and at various time-points thereafter, were CD8+ T cell–depleted and stained with MHC II tetramers appropriate for the donor MHC type, and with no tetramer as a control followed by anti-CD4. Flow cytometric plots present the percentage of tetramer-bound cells within the total CD4+ T cell population at each time point. Results are representative of 11 IM donors who donated additional blood samples over a period of up to 2 yr.
Figure 7.
Figure 7.
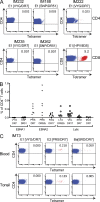
Absence of EBNA1-specific CD4+ T cell responses in acute IM. (A) Analysis of CD4+ T cell responses to the EBNA1 MHC II tetramers E1 [VYG/DR7] and E1 [SNP/DR51] in CD8+ T cell–depleted PBMCs from five acute IM donors. For donor IM222, an aliquot of undepleted PBMCs from the same cryopreserved PBMCs were stained with a B35 MHC I HPV tetramer (E1 [HPV/B35]) followed by anti-CD8 antibody. The numbers in the top right quadrants refer to the percentage of total CD4+ or CD8+ T cells staining with the tetramer in each case. Results are representative of 16 acute IM donors. (B) Summary of percentage frequencies of CD4+ T cells staining with MHC II tetramers of relevant specificity in 21 acute IM donors. (C) Analysis of EBV epitope-specific CD4+ T cells in matched blood (top) and tonsillar mononuclear cells (bottom) prepared from an IM tonsillectomy patient. Cells were stained with E1 [VYG/DR7], E2 [PRS/DR7], or Ba [SRD/DR7] tetramers followed by anti-CD4. Values in the top right quadrants refer to the percentage of total CD4+ T cells that stained with the tetramer in each case. Note that, due to limited availability of cells, these analyses were performed on 2 × 10⁵ cells per tube. Results are representative of two donors.
Figure 8.
Figure 8.
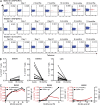
Delayed kinetics of the EBNA1-specific CD4+ T cell responses to EBV infection. (A) PBMCs cryopreserved from Donors IM253, IM265, and IM260 during acute IM and at various time points thereafter, were CD8+ T cell depleted and stained with E1 MHC II tetramers appropriate for the donor MHC type and with no tetramer as a control. All cells were subsequently stained with anti-CD4. Flow cytometric plots present the percentage of tetramer-bound cells within the total CD4+ T cell population at each time point. Results are representative of seven IM donors. (B) Summary of percentages of CD4+ T cells staining with EBNA1, EBNA2, and lytic antigen MHC II tetramers in PBMCs from a total of 11 IM donors of appropriate MHC II type, which were cryopreserved at the time of primary EBV infection and at the latest available time point >6 mo later. (C) Graphical representation of the data presented in part A showing the percentage of E1 MHC II tetramer-bound cells within the total CD4+ T cell population detected by flow cytometry at each time point (red, left axis). The same graphs show the EBNA1 IgG Index Value (arbitrary units) within the plasma collected from the same samples (black, left axis). All serial plasma samples from each patient were analyzed at the following dilutions, which were determined by prior titration assays as described in Materials and methods: 1 in 800 for IM253, 1 in 400 for IM265, and 1 in 100 for IM260.
Figure 9.
Figure 9.
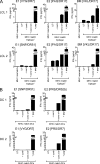
Intercellular transfer confers CD4+ T cell recognition of EBNA2 and lytic antigens, but not EBNA1. (A) T cells assays involving recipient (LCL 1) MHC DR7+DR17+ LCLs transformed with Ag876 strain EBV and (LCL 2) MHC DR51+DR17+ LCLs transformed with a recombinant B95.8 BZLF1 k/o virus. Recipient cells were incubated overnight with 25-fold conc s/n medium from a MHC II–mismatched B95.8-strain LCL (+ conc s/n); controls were the same line either left untreated, incubated overnight with 25-fold concentrated control medium from the EBV-negative cell line BJAB (+ cont) or exposed to 5 µM epitope peptide for 1 h. After incubation, all cells were washed and used as targets in T cell assays, along with a MHC II mismatched target LCL as a negative control, at 5 × 10⁴ cells/well with VYG-, SNP-, PAQ-, or VKL-epitope specific CD4+ T cell clones (104 cells/well). Results, which are expressed as IFN-γ release from the T cells (ng/ml), are representative of three replicate experiments and are the mean ± 1SD of triplicate wells, as determined by ELISA. (B) T cell assays involving recipient MHC DR51+DR52b+ (DC 1) and MHC DR7+ (DC 2) DCs either untreated (UT), or incubated for 6 h with 25-fold conc s/n medium from a MHC II–mismatched B95.8-strain LCL (+ conc s/n) or with medium from the control EBV-negative cell line BJAB (+ cont) before 2 d maturation, or exposed to 5 µM epitope peptide for 1 h after 2 d maturation. After incubation, all cells were washed and used as targets in T cell assays as in A with SNP, PRS, or VYG-specific CD4+ T cell clones.

Similar articles

Cited by

References

    1. Adhikary D., Behrends U., Moosmann A., Witter K., Bornkamm G.W., Mautner J. 2006. Control of Epstein-Barr virus infection in vitro by T helper cells specific for virion glycoproteins. J. Exp. Med. 203:995–1006 10.1084/jem.20051287 - DOI - PMC - PubMed
    1. Adhikary D., Behrends U., Boerschmann H., Pfünder A., Burdach S., Moosmann A., Witter K., Bornkamm G.W., Mautner J. 2007. Immunodominance of lytic cycle antigens in Epstein-Barr virus-specific CD4+ T cell preparations for therapy. PLoS ONE. 2:e583 10.1371/journal.pone.0000583 - DOI - PMC - PubMed
    1. Amyes E., Hatton C., Montamat-Sicotte D., Gudgeon N., Rickinson A.B., McMichael A.J., Callan M.F. 2003. Characterization of the CD4+ T cell response to Epstein-Barr virus during primary and persistent infection. J. Exp. Med. 198:903–911 10.1084/jem.20022058 - DOI - PMC - PubMed
    1. Amyes E., McMichael A.J., Callan M.F. 2005. Human CD4+ T cells are predominantly distributed among six phenotypically and functionally distinct subsets. J. Immunol. 175:5765–5773 - PubMed
    1. Benninger-Döring G., Pepperl S., Deml L., Modrow S., Wolf H., Jilg W. 1999. Frequency of CD8(+) T lymphocytes specific for lytic and latent antigens of Epstein-Barr virus in healthy virus carriers. Virology. 264:289–297 10.1006/viro.1999.9996 - DOI - PubMed

Publication types

MeSH terms