. 2013 Apr 25;3(4):1093-104.
doi: 10.1016/j.celrep.2013.03.014. Epub 2013 Apr 4.

Genomic regions flanking E-box binding sites influence DNA binding specificity of bHLH transcription factors through DNA shape

Affiliations

Genomic regions flanking E-box binding sites influence DNA binding specificity of bHLH transcription factors through DNA shape

Raluca Gordân et al. Cell Rep. .

Abstract

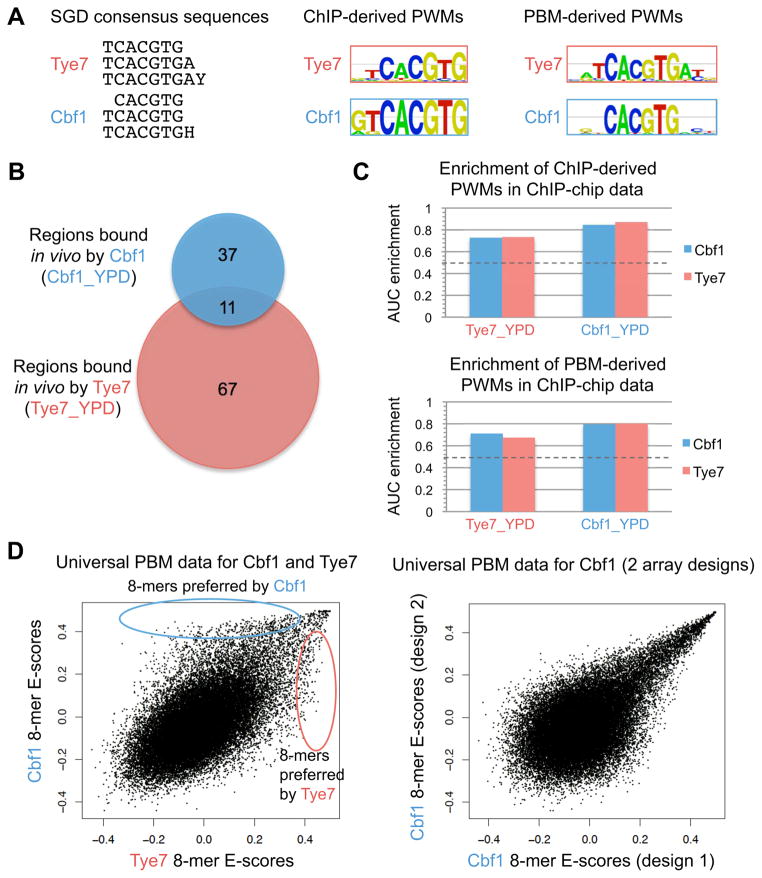
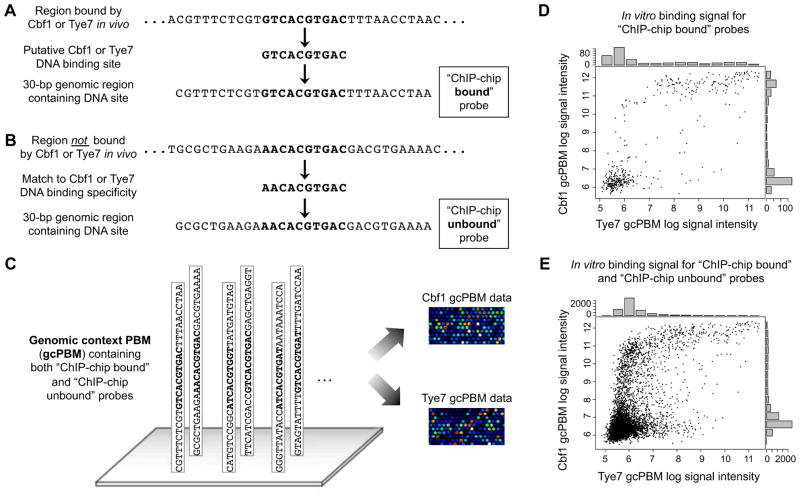
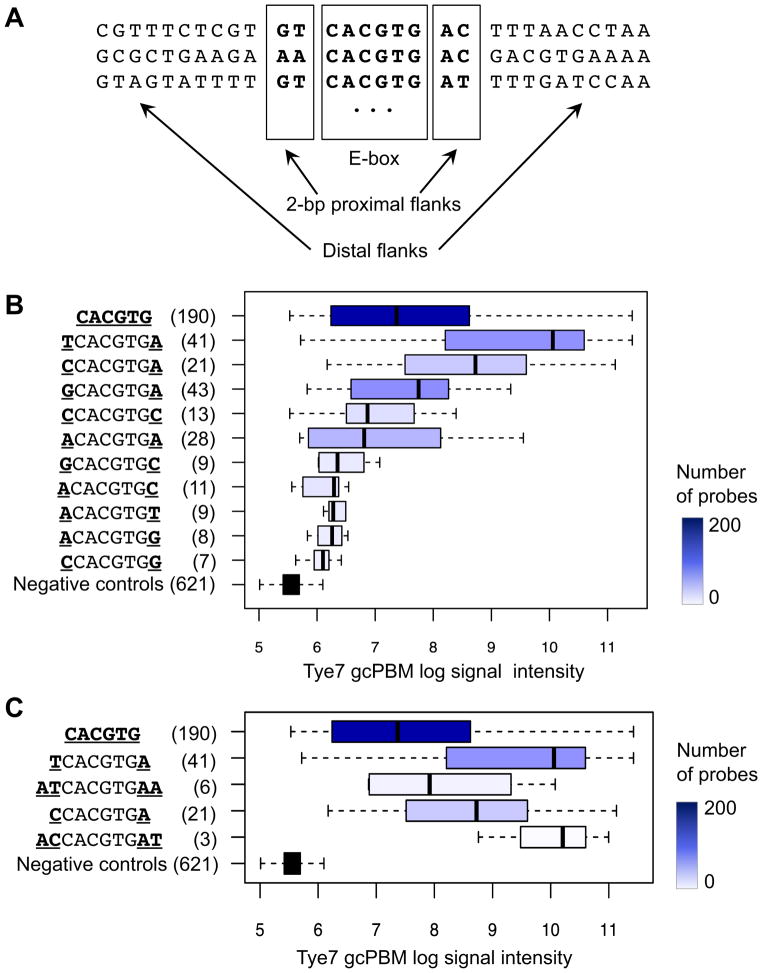
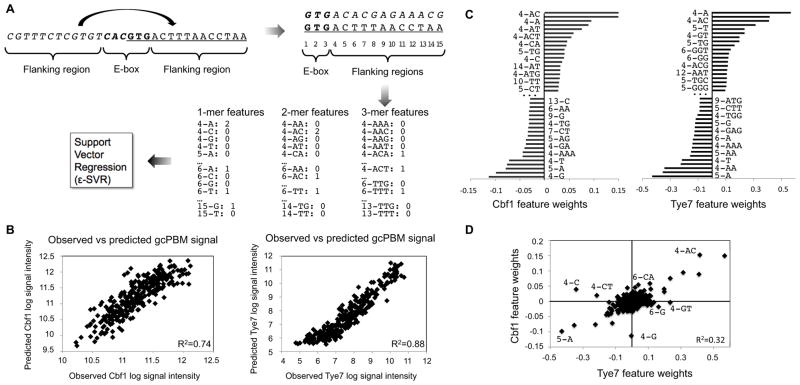
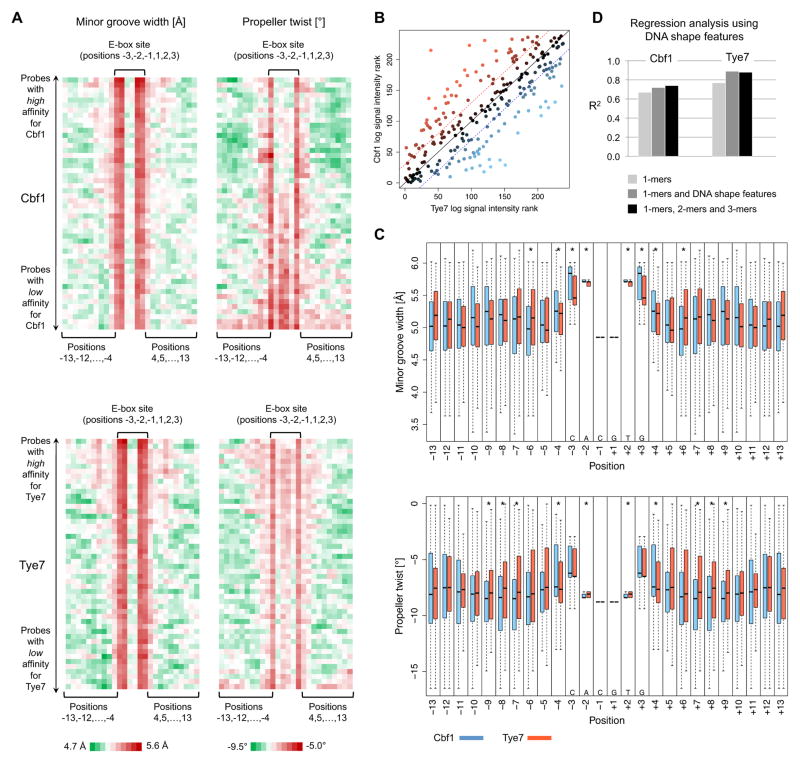
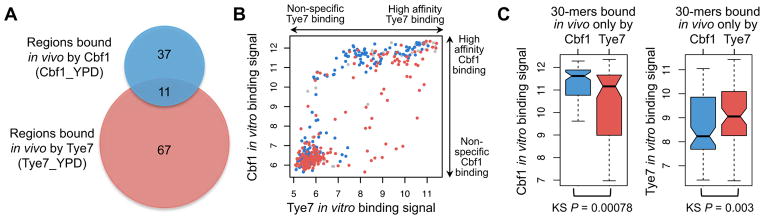
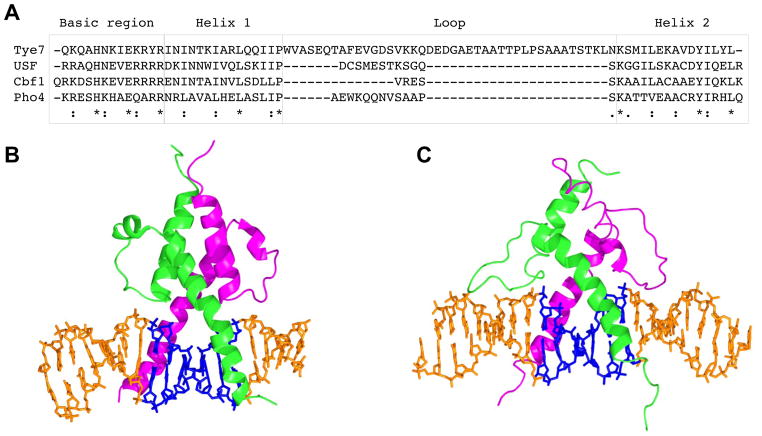
DNA sequence is a major determinant of the binding specificity of transcription factors (TFs) for their genomic targets. However, eukaryotic cells often express, at the same time, TFs with highly similar DNA binding motifs but distinct in vivo targets. Currently, it is not well understood how TFs with seemingly identical DNA motifs achieve unique specificities in vivo. Here, we used custom protein-binding microarrays to analyze TF specificity for putative binding sites in their genomic sequence context. Using yeast TFs Cbf1 and Tye7 as our case studies, we found that binding sites of these bHLH TFs (i.e., E-boxes) are bound differently in vitro and in vivo, depending on their genomic context. Computational analyses suggest that nucleotides outside E-box binding sites contribute to specificity by influencing the three-dimensional structure of DNA binding sites. Thus, the local shape of target sites might play a widespread role in achieving regulatory specificity within TF families.


Figures

Figure 1
Figure 1
DNA binding specificities of S. cerevisiae Cbf1 and Tye7. (A) Cbf1 and Tye7 have highly similar DNA binding specificities according to consensus sequences in SGD, PWMs from ChIP-chip data (Harbison et al., 2004), or PWMs from universal PBM data (Zhu et al., 2009)). (B) Cbf1 and Tye7 have little overlap in genomic regions bound in rich medium (YPD) (ChIP-chip P > 0.005 (Harbison et al., 2004)). (C) PWMs of Cbf1 and Tye7 are enriched both in genomic regions bound in Cbf1_YPD and Tye7_YPD ChIP-chip data. Dotted line shows expected enrichment for a random PWM. (D) Universal PBM data for Cbf1 and Tye7 show differences not seen in replicate PBM experiments for the same TF (not shown) nor in PBM experiments for the same factor on two different universal array designs (right plot). See also Figure S2.
Figure 2
Figure 2
Design of genomic context PBM to compare Cbf1 and Tye7 DNA binding preferences. Arrays included (A) “ChIP-chip bound” probes and (B) “ChIP-chip unbound” probes, representing 30-bp genomic regions; see Extended Experimental Procedures for details. Cbf1 and Tye7 show significant differences in binding in vitro to (D) “ChIP-chip bound” (E) and “ChIP-chip unbound” probes. Both proteins were tested at 200 nM in PBMs. The plots show the natural logarithm of the normalized PBM signal intensities, with higher numbers corresponding to higher affinity binding. See also Figure S1.
Figure 3
Figure 3
Flanking sequences contribute to Cbf1 and Tye7 DNA binding specificity. (A) Proximal or distal flanks surrounding the E-box result in (B) variation in Tye7 DNA binding signal for probes that contain the preferred E-box CACGTG, or any of the possible 8-mers centered at this E-box. Numbers in parentheses indicate number of probes containing each 6-mer or 8-mer. (C) Wide variation in DNA binding signal is observed even when we restrict the analysis to probes containing specific 10-mers. See also Figure S3.
Figure 4
Figure 4
Regression analysis of gcPBM data. (A) For each 30-bp probe, we combined the two flanking regions and we generated 1-mer, 2-mer, and 3-mer features. We used ε-SVR to train linear models that predict the PBM log signal intensity of each probe based on its sequence features. Positions are numbered starting from the center of the CACGTG core. (B) Leave-one-out cross-validation analysis indicates that regression models for Cbf1 and Tye7 accurately predict PBM signal intensity. (C) Analysis of the sequence features with the largest positive and negative weights in SVR models shows that base pairs in both the proximal and distal flanks are important for predicting DNA binding specificity. Bar plots show the top 20 positive and negative weights. For brevity, feature names are shown only for the top positive/negative weight, and then for every other weight among the top 20. (D) Features show numerous differences between Cbf1 and Tye7. See also Figure S4 and Table S1.
Figure 5
Figure 5
DNA shape analysis. (A) Heat maps show the average minor groove width (left) and propeller twist (right) for sequences on the gcPBM. Sequences were sorted in decreasing order of gcPBM signal intensity for either Cbf1 (top) or Tye7 (bottom), and grouped into 50 bins. Average DNA shape parameters were computed within each bin. (B) Different proximal flanks surrounding the common CACGTG E-box are preferred by Tye7 and Cbf1. Sequences located in the upper left triangle are preferentially bound by Tye7 and 10-mers located in the lower right triangle are preferentially bound by Cbf1. Dashed lines indicate respective cutoffs of a difference ≥ 30 in rank between Tye7 preferred (red) and Cbf1 preferred (blue). Lighter colored dots exhibit larger differences. (C) DNA shape variation due to flanks surrounding CACGTG selected preferentially by Cbf1 (light blue) or Tye7 (light red), comparing. Asterisks (*) indicate positions with significant differences (P < 0.05, Mann-Whitney U-test) in the minor groove width (upper) or propeller twist (lower) between the sequences preferred by Cbf1 or Tye7. The symmetry of the box plots is due to the shape predictions having been performed for the combined flanks. (D) Incorporating DNA shape features improves binding intensity predictions in comparison to using DNA sequence (1-mers) alone. The improvement is similar to that obtained by adding 2-mer and 3-mer features. See also Figure S5.
Figure 6
Figure 6
Differences in the in vitro DNA binding preferences of Cbf1 and Tye7 are important for differential in vivo binding. (A) Overlap between sets of genomic regions bound by Cbf1 and Tye7 in ChIP-chip in rich medium (YPD). (B) Scatter plot of Tye7 versus Cbf1 PBM log signal intensity for 30-mer probes that occur in genomic regions bound in vivo only in Tye7_YPD (red), only in Cbf1_YPD (blue) or in both data sets (grey). (C) Cbf1 and Tye7 in vitro binding signal (i.e., natural logarithm of gcPBM probe intensity) for 30-mers probes selected from genomic regions bound only by Cbf1 (blue) or only by Tye7 (red) in vivo. The differences in PBM log signal intensity between the two sets of 30-mer probes are statistically significant by Kolmogorov-Smirnov (KS) tests. See also Figure S6.
Figure 7
Figure 7
Sequence and structure comparison of bHLH/DNA complexes. (A) Sequence alignment of S. cerevisiae Tye7, Cbf1, and Pho4, and human USF shows the sequence and length variation of the loops between α-helices H1 and H2. In complex with their target sites, (B) yeast Pho4 and (C) human USF form base-specific contacts with the E-box while the loops between the H1 and H2 helices of the bHLH motifs adopt different conformations. The bHLH-DNA complexes shown are based on crystal structures with PDB IDs (B) 1A0A and (C) 1AN4.

Similar articles

Cited by

References

    1. Arvey A, Agius P, Noble WS, Leslie C. Sequence and chromatin determinants of cell-type-specific transcription factor binding. Genome Res. 2012;22:1723–1734. - PMC - PubMed
    1. Atchley WR, Fitch WM. A natural classification of the basic helix-loop-helix class of transcription factors. PNAS. 1997;94:5172–5176. - PMC - PubMed
    1. Badis G, Berger MF, Philippakis AA, Talukder S, Gehrke AR, Jaeger SA, Chan ET, Metzler G, Vedenko A, Chen X, et al. Diversity and complexity in DNA recognition by transcription factors. Science. 2009;324:1720–1723. - PMC - PubMed
    1. Berger MF, Bulyk ML. Universal protein-binding microarrays for the comprehensive characterization of the DNA-binding specificities of transcription factors. Nature Protocols. 2009;4:393–411. - PMC - PubMed
    1. Berger MF, Philippakis AA, Qureshi AM, He FS, Estep PW, 3rd, Bulyk ML. Compact, universal DNA microarrays to comprehensively determine transcription-factor binding site specificities. Nat Biotechnol. 2006;24:1429–1435. - PMC - PubMed

Publication types

MeSH terms

Substances

Associated data