. 2013;8(3):e59226.
doi: 10.1371/journal.pone.0059226. Epub 2013 Mar 28.

Cartilage-specific over-expression of CCN family member 2/connective tissue growth factor (CCN2/CTGF) stimulates insulin-like growth factor expression and bone growth

Affiliations

Cartilage-specific over-expression of CCN family member 2/connective tissue growth factor (CCN2/CTGF) stimulates insulin-like growth factor expression and bone growth

Nao Tomita et al. PLoS One. 2013.

Abstract

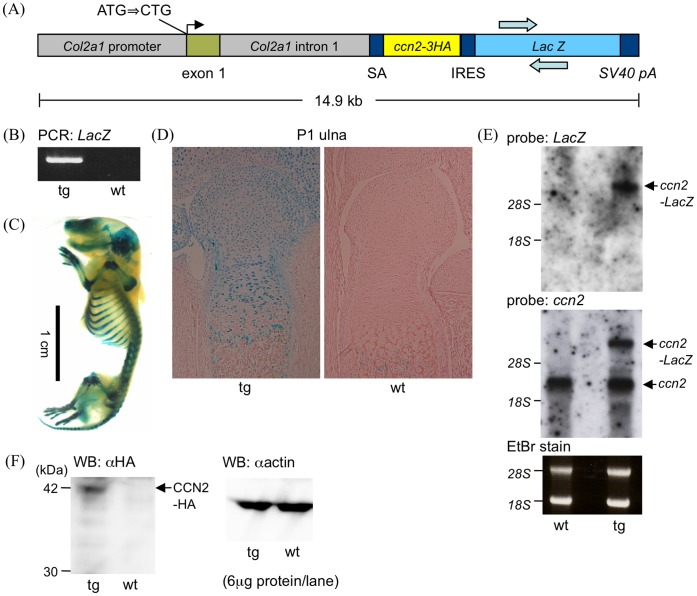
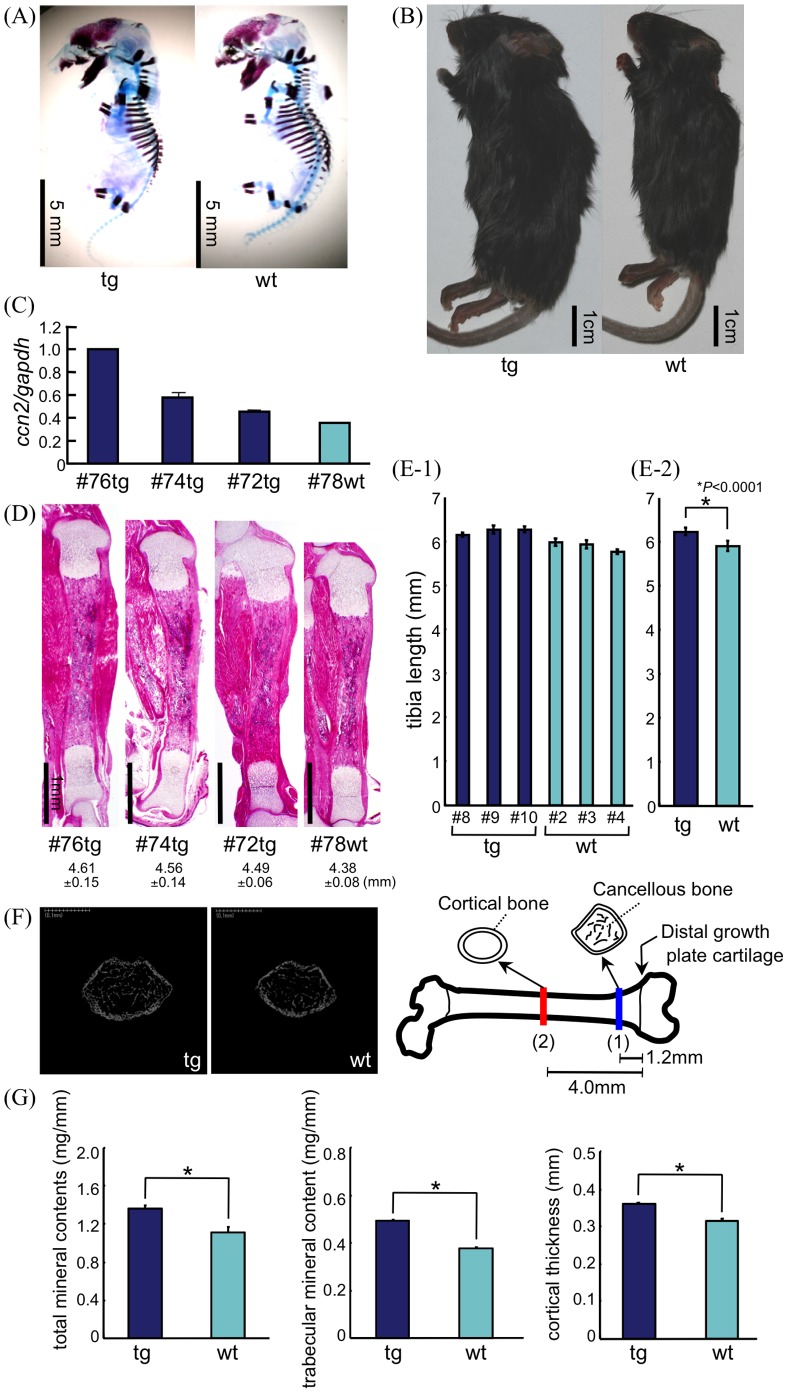
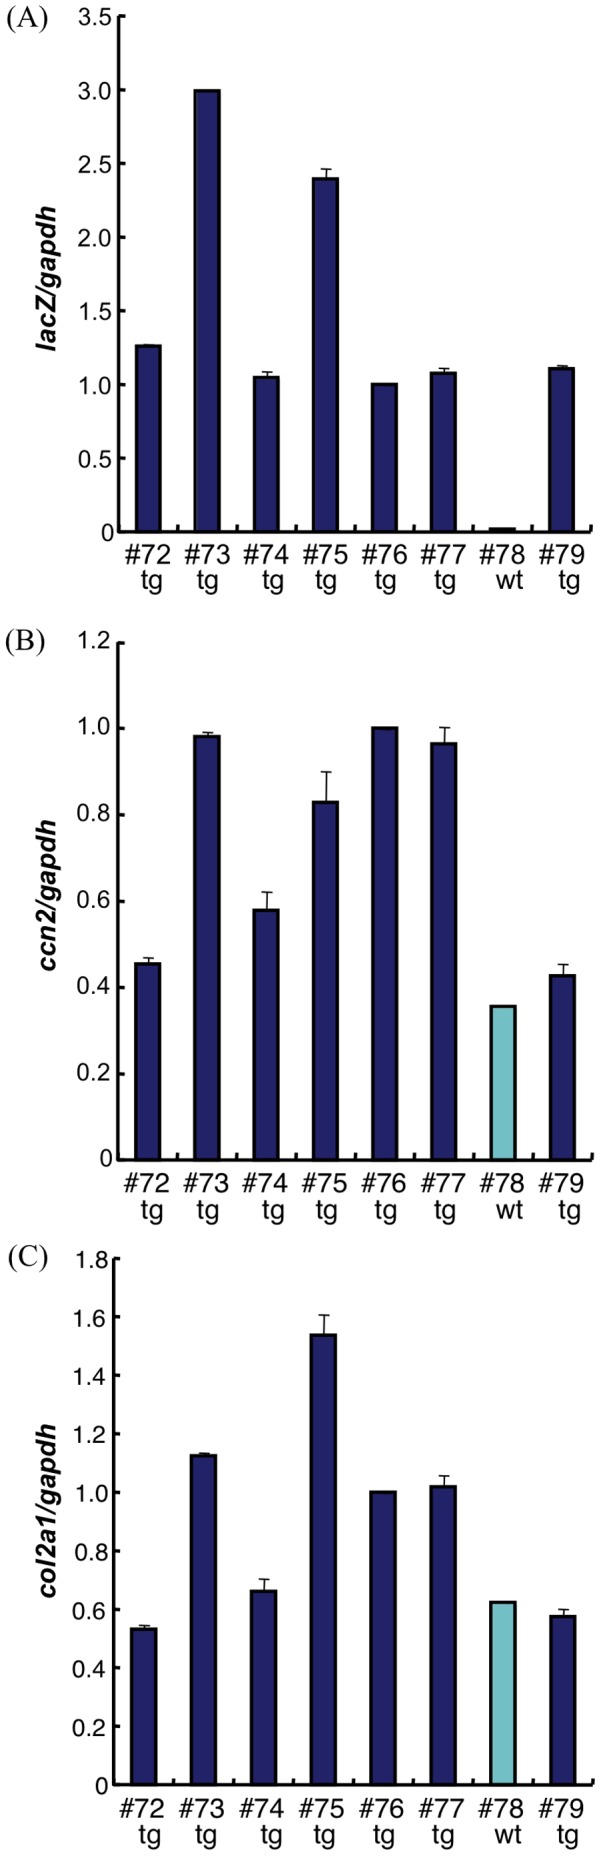
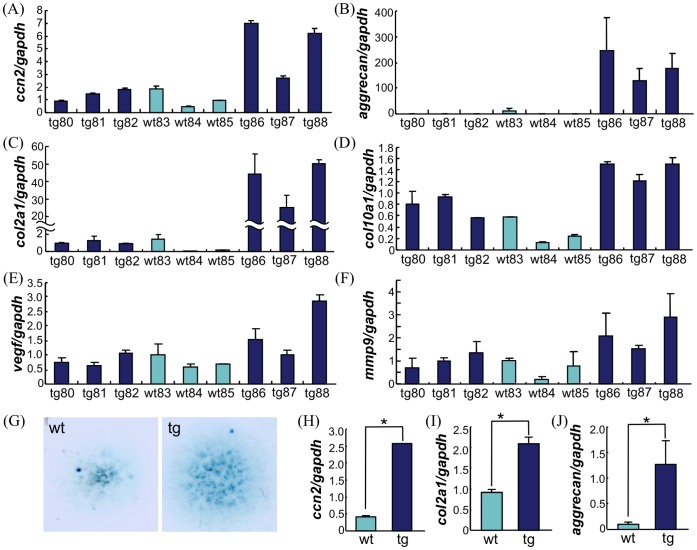
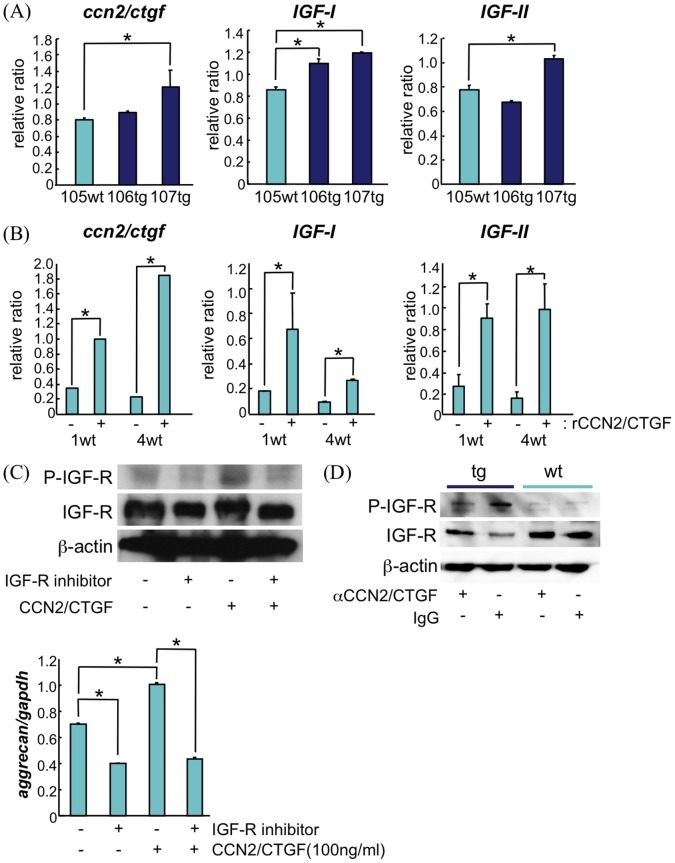
Previously we showed that CCN family member 2/connective tissue growth factor (CCN2) promotes the proliferation, differentiation, and maturation of growth cartilage cells in vitro. To elucidate the specific role and molecular mechanism of CCN2 in cartilage development in vivo, in the present study we generated transgenic mice overexpressing CCN2 and analyzed them with respect to cartilage and bone development. Transgenic mice were generated expressing a ccn2/lacZ fusion gene in cartilage under the control of the 6 kb-Col2a1-enhancer/promoter. Changes in cartilage and bone development were analyzed histologically and immunohistologically and also by micro CT. Primary chondrocytes as well as limb bud mesenchymal cells were cultured and analyzed for changes in expression of cartilage-related genes, and non-transgenic chondrocytes were treated in culture with recombinant CCN2. Newborn transgenic mice showed extended length of their long bones, increased content of proteoglycans and collagen II accumulation. Micro-CT analysis of transgenic bones indicated increases in bone thickness and mineral density. Chondrocyte proliferation was enhanced in the transgenic cartilage. In in vitro short-term cultures of transgenic chondrocytes, the expression of col2a1, aggrecan and ccn2 genes was substantially enhanced; and in long-term cultures the expression levels of these genes were further enhanced. Also, in vitro chondrogenesis was strongly enhanced. IGF-I and IGF-II mRNA levels were elevated in transgenic chondrocytes, and treatment of non-transgenic chondrocytes with recombinant CCN2 stimulated the expression of these mRNA. The addition of CCN2 to non-transgenic chondrocytes induced the phosphorylation of IGFR, and ccn2-overexpressing chondrocytes showed enhanced phosphorylation of IGFR. Our data indicates that the observed effects of CCN2 may be mediated in part by CCN2-induced overexpression of IGF-I and IGF-II. These findings indicate that CCN2-overexpression in transgenic mice accelerated the endochondral ossification processes, resulting in increased length of their long bones. Our results also indicate the possible involvement of locally enhanced IGF-I or IGF-II in this extended bone growth.


Conflict of interest statement

Competing Interests: The authors have declared that no competing interests exist.

Figures

Figure 1
Figure 1. Generation of Col2a1-ccn2 transgenic mice.
(A) Schematic representation of the construct of the expression of HA-tagged CCN2 and IRES-LacZ in chondrocytes driven by the 6-kb Col2a1 promoter-enhancer. The original initiation codon of Col2a1 was mutated to CTG to facilitate translation from downstream cDNA. (B) Genotyping of transgenic mice (tg) by PCR to detect the transgene. wt, wild type. The location of the primers used are indicated in “A” by arrows. (C) Skeletal preparation of a newborn mouse after whole-mount X-gal staining, showing cartilage-specific expression of the transgene. (D) Sagittal sections of ulnae from wt and tg after whole-mount X-gal staining. All of the cartilaginous cells showed X-gal staining. The sections were counter-stained with Safranin-O. (E) Analysis of transgene expression by Northern hybridization using total RNA from tg and wt cartilage. LacZ (top) and ccn2 (middle) probes were used to detect transgenic and endogenous ccn2, respectively. (F) Western blot (WB) analysis using cell lysates from tg and wt cartilage and anti-HA antibody recognizing only the CCN2-HA transgene products (left blot). The HA-tagged CCN2 was expressed in cartilage of tg mice. A Western blot of the same cell lysate reacted with anti-actin antibody as a loading control is also shown (right blot).
Figure 2
Figure 2. Skeletal analysis of Col2a1-ccn2 transgenic mice.
(A) Skeletal preparation of representative tg and wt littermates at E15.5 after alizarin red and Alcian blue staining. Skeletal development in tg mice appeared normal at this stage. (B) At 8 weeks the transgenic mice consistently showed an ∼12% increase in body size. (C) Quantitative analysis by real-time PCR of ccn2 mRNA levels in primary cultures of tg and wt rib chondrocytes revealed high-expressing transgenic mice (e.g., #76,#74) in each litter, besides low-expressing littermates (#tg72), the latter of which expressed ccn2 at about the same level as the wt littermates (see also Fig. 2D). Real time-RCR analysis was repeated at least 2 times for each RNA preparation, and the 2 founder lines showed similar variations, but basically the same results. (D) Hematoxylin-eosin (HE) staining of transgenic and wild-type P1 tibiae from the same littermates as shown in Fig. 2C. Tibiae from transgenic mice showed a relatively extended length of the diaphyses in the high-expressing transgenic littermates. Tg and wt with a number indicate transgenic and non-transgenic littermates, respectively. Six litters from 2 different founder lines were investigated. (E-1) Diaphysis length of tibiae from transgenic and wild-type littermates of a P3 litter. Tibial diaphysis lengths of only pups that showed significantly enhanced levels of ccn2 mRNA, measured in primary cultures of rib chondrocytes were measured. Serial sections (5–7 slides) were randomly selected every 3 slides from a single tibia, and stained with HE. The images were incorporated into a computer, and the length of diaphyses were measured. Bars indicate the mean length and standard deviations of diaphyses of tibia from wild-type and transgenic littermates (e.g. 2 wt, 8 tg). (E-2) Mean length of diaphyses of tibiae from the wild-type and transgenic mice indicated in E-1. *: p<0.0001. Two different founder lines with 3 litters each were analyzed and similar results were obtained. (F) Left: Representative micro-CT image (cross section) of femora of 8-week-old tg and wt littermates. Right: Positions of measurement in femur. (G) Peripheral quantitative computed tomography analysis of bone density and mineral content was made at 2 sites, one 1.2 mm (site #1, blue), and the other 4.0 mm (site #2, red), distal to the growth plate, as indicated in “F” (right). Bars represent the mean ±SD (n = 9, males). In transgenic bones significant enhancement was seen in total mineral content (tg: 1.36±0.08 mg/mm vs. wt: 1.10±0.12 mg/mm), in trabecular mineral content (tg: 0.49±0.01 mg/mm vs. wt: 0.38±0.01 mg/mm), and in cortical thickness (tg: 0.060±0.013 mm vs. wt: 0.049±0.021 mm); but only in the femora at site #1 were the differences significant (*P<0.05).
Figure 3
Figure 3. CCN2 overexpression causes enhanced type II collagen and proteoglycan deposition, enhanced chondrocyte proliferation and shortening of the hypertrophic cartilage zone.
Tibiae from P1 littermates were stained with safranin-O for proteoglycans (A, left) and with anti-type II collagen antibody (B, left). Whole littermates were analyzed and the color intensity of 3 different wt or tg individuals was measured densitometrically; and the mean values are presented. (A, right; and B, right). *: p<0.005. Typical images from tg and wt littermates are shown. (C, left) Comparison of hypertrophic cartilage zone of CCN2 transgenic littermates. Tibiae were stained with type X collagen antibody. (C, right) The hypertrophic zone of tg cartilage appeared shorter compared with that of the wt cartilage. (D) Immunohistochemical analysis of proliferative cell nuclear antigen (PCNA) in tibiae of ccn2 tg embryos at E19.5. Proliferative cells were observed in the whole epiphyseal cartilage of tg animals, whereas they were restricted to the proliferative zone of the wt littermates. The number of PCNA-positive cells inside of the boxed area was counted in 5 fields of 3 comparable wt and tg sections. Mean values indicate enhanced chondrocyte proliferation in the tg cartilage (graph at the lower right). *: p<0. 05.
Figure 4
Figure 4. Gene expression analysis reveals enhanced Col2a1 and ccn2 in chondrocyte primary cultures of Col2a1-ccn2 transgenic mice.
To obtain high ccn2 transgene-expressing littermates, we crossed transgenic male and female mice within same founder line; and expression of LacZ, ccn2, and Col2a1 mRNA was measured by real-time PCR from 5 d chondrocyte cultures prepared from E18.5 wt and tg embryos. LacZ analysis revealed that high and low lacZ-expressing tg littermates and 1 wt were obtained (A). On average, ccn2 expression levels in tg chondrocytes were significantly higher than those in wild-type littermates (B). Col2a1 mRNA levels in tg chondrocytes were 2–3 fold higher than those in wt chondrocytes (C). Primary cultures of rib chondrocytes from individual littermates were prepared 3 times from each of the 2 founder lines, and total RNA were prepared. Real time-RCR analysis was repeated at least 2 times for each RNA preparation; and the 2 founder lines showed similar variations, but gave basically the same results. Primary-chondrocytes from ccn2 tg and wt littermates were also pooled; and gene expression was analyzed as shown in figure S2.
Figure 5
Figure 5. Ccn2 overexpression on Col2a1-ccn2 transgenic mice stimulates expression of marker gene of late hypertrophy and chondrogenesis of limb bud mesenchymal cells.
For real-time PCR analysis of gene expression, primary chondrocytes isolated from ribs of ccn2 tg and wt littermates were cultured for 1 month under differentiation-promoting conditions (A–F). In high-expressing tg samples, high levels of ccn2 mRNA were retained during the entire culture time; whereas low expressers showed ccn2 mRNA levels similar to those of wt chondrocytes (A). Expression of ECM components such as aggrecan (B) and Col2a1 (C) was strongly up-regulated in the cultures that high levels of ccn2 mRNA. Markers of late hypertrophic chondrocytes such as Col10a1 (D), vegf (E), and mmp9 (F) were also upregulated in those cultures. Expression levels of 1 representative litter out of 3 litters are shown. Primary 1 month cultures of rib chondrocytes from individual littermates were prepared twice from 2 founder lines; and total RNA was extracted. Real time-RCR analysis was repeated at least twice for the each RNA preparation. The 2 founder lines showed similar variations, but basically the same results. (G–J) Micromass cultures of mesenchymal cells derived from tg and wt E11.5 littermates. After 3 days in culture, nodule formation was accelerated in the cultures derived from ccn2-overexpressing mice as shown by Alcian blue (pH 1, G) and RNA was extracted for real-time PCR analysis. Cultures prepared from ccn2 over-expressing mice showed enhanced expression of ccn2 (H), Col2a1 (I), and aggrecan (J) mRNA. *: p<0.005. RNA of each littermates was individually analyzed and nodule formation among ccn2 wt or tg was similar. Typical images of ccn2 wt and tg are shown. Real time-RCR analysis was repeated at least 2 times for each RNA preparation. Micromass cultures of mesenchymal cells derived from E11.5 littermates were prepared 4 times from 2 founder lines, and basically similar results were obtained.
Figure 6
Figure 6. CCN2 stimulates IGF-IGFR pathway.
Enhanced expression of IGF-I and IGF-II in primary cultures was found in primary cultures of chondrocytes prepared from the cartilage of ccn2-over-expressing mice, and in wt chondrocytes after treatment with recombinant CCN2. (A) Real-time PCR analysis of total RNA from tg cartilage which showed higher expression of ccn2 (107 tg) than wt cartilage (105 wt) also showed enhanced expression of IGF-I and II, whereas 106 tg with low ccn2 overexpression showed no enhanced IGF-II, but enhanced IGF-I expression. *:p<0.05. (B) Addition of recombinant CCN2 (50 ng/ml) to primary cultures of wt mouse rib chondrocytes stimulated IGF-I and II mRNA as well as ccn2 mRNA expression. Primary cultures of chondrocytes were prepared from wt E18.5 embryos; and the cells were seeded at 2×10⁵ cells in 3.5-cm dishes with or without rCCN2 in the media, and incubated for 5 days. mRNA levels were standardized with gapdh; and all reactions were done in triplicate. Values for 1 wt and 4 wt are from 2 independently generated cultures. *:p<0.005. (C) Phosphorylation of IGF receptor induced by addition of rCCN2 (100 ng/ml) for 24 hours to primary cultures of wt rib chondrocytes, and inhibition of this phosphorylation of IGFR by PPP, an inhibitor of autophosphorylation of IGFR (upper panel). Aggrecan mRNA levels were measured (lower panel) and standardized to gapdh; and all reactions were done in triplicate. (D) Enhanced phosphorylation of IGFR in ccn2-overexpressing chondrocytes and inhibition of phosphorylation of IGFR by CCN2 antibody. Primary cultures of chondrocytes were pooled from P3 rib cages of ccn2 tg and wt littermates; and cells were seeded at 2×10⁵ cells in 3.5-cm dishes and cultured for 2 days until the cells had reached the confluent state. CCN2 antibody or control IgG was added to the media, and the cultures were then incubated for 24 hours, after which the cells were collected with lysis buffer.

Similar articles

Cited by

References

    1. Brigstock DR (2003) The CCN family: a new stimulus package. J Endocrinol 178: 169–175. - PubMed
    1. Takigawa M, Nishida T, Kubota S (2005) Roles of CCN2/CTGF in the cntrol of growth and regeneration. In: Perbal B, Takigawa M, editors. CCN Proteins: A new family of cell growth and differentiation regulators. London: Imperial College Press. 19–59.
    1. Kubota S, Takigawa M (2007) Role of CCN2/CTGF/Hcs24 in bone growth. Int Rev Cytol 257: 1–41. - PubMed
    1. Takigawa M, Nakanishi T, Kubota S, Nishida T (2003) Role of CTGF/HCS24/ecogenin in skeletal growth control. J Cell Physiol 194: 256–266. - PubMed
    1. Shimo T, Nakanishi T, Kimura Y, Nishida T, Ishizeki K, et al. (1998) Inhibition of endogenous expression of connective tissue growth factor by its antisense oligonucleotide and antisense RNA suppresses proliferation and migration of vascular endothelial cells. J Biochem 124: 130–140. - PubMed

Publication types

MeSH terms

Grants and funding

This work was supported by the program Grants-in-Aid for Scientific Research (C) to TH and (S) to MT and Exploratory Research (to MT) from the Japan Society for the Promotion of Science and by internal grants from Okayama University (to TH) and by a grant from Senri Life Science Foundation (to TH). The funders had no role in study design, data collection and analysis, decision to publish, or preparation of the manuscript.

LinkOut - more resources