

A discriminative approach for unsupervised clustering of DNA sequence motifs
- PMID: 23555204
- PMCID: PMC3605052
- DOI: 10.1371/journal.pcbi.1002958
A discriminative approach for unsupervised clustering of DNA sequence motifs
Abstract
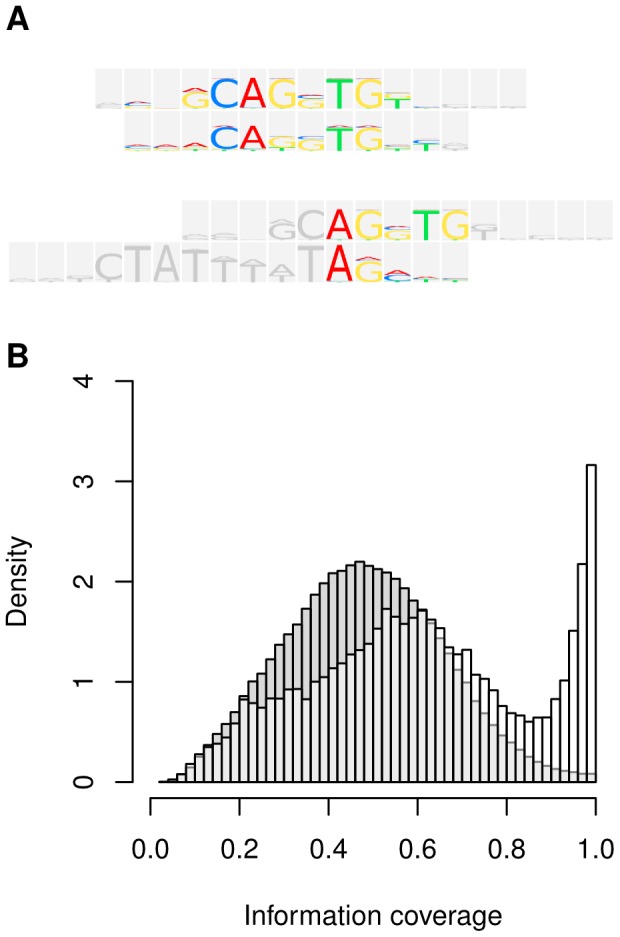
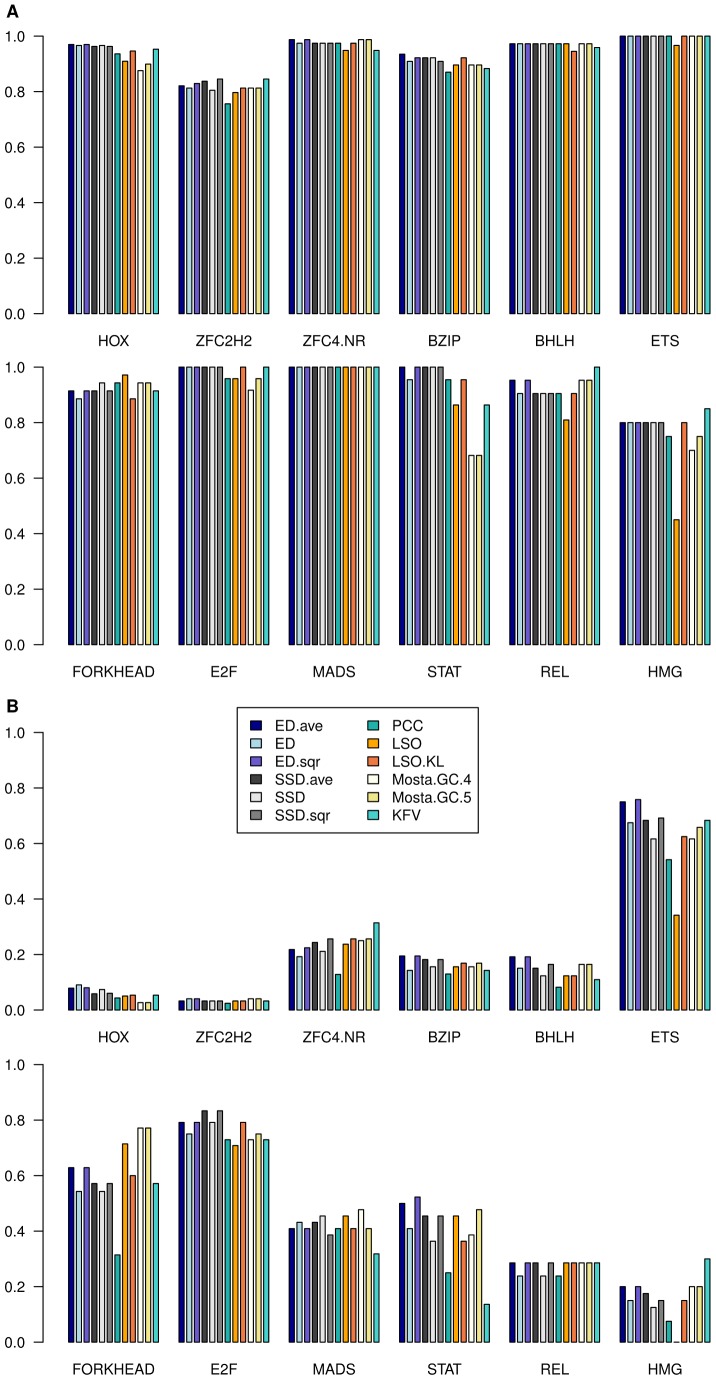
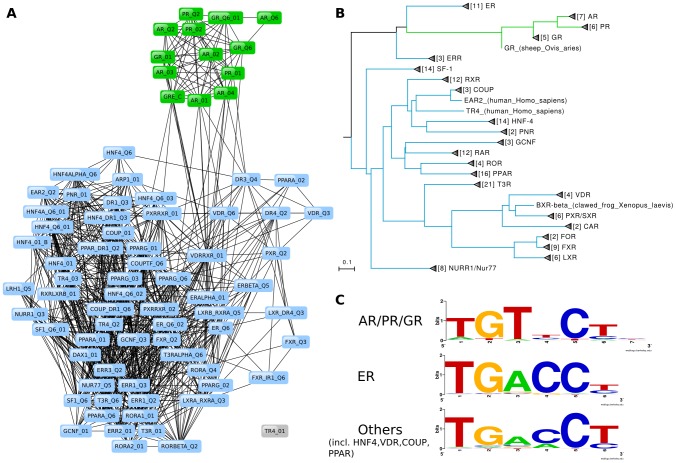
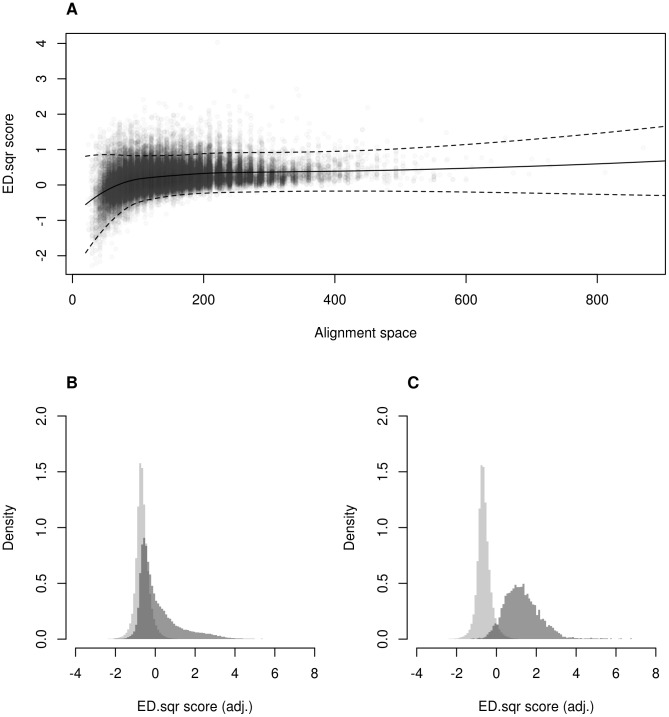
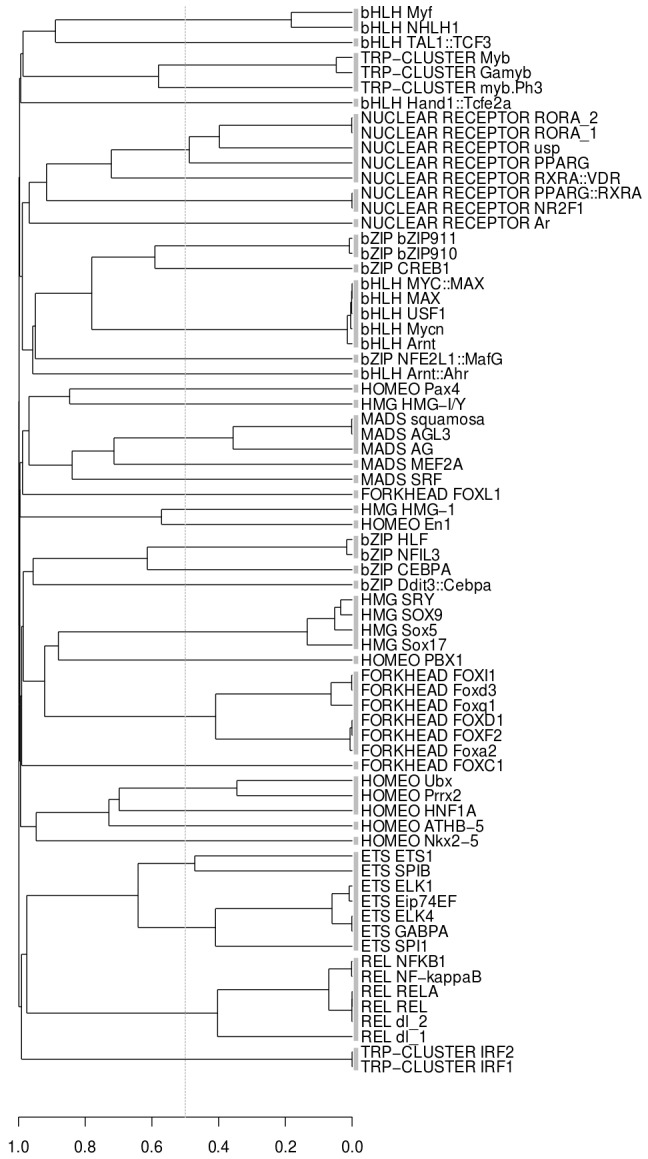
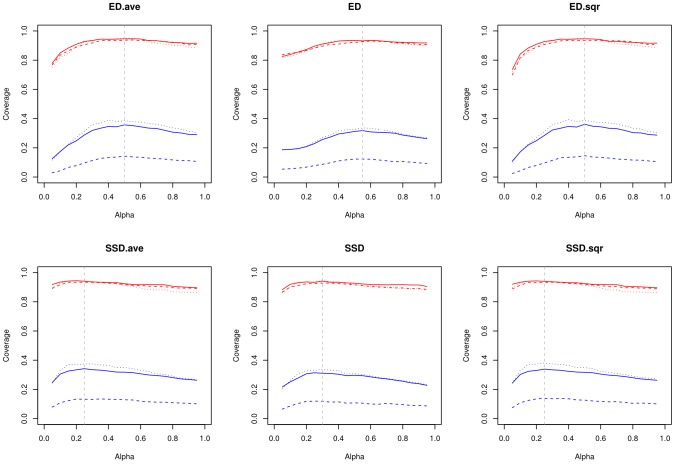
Algorithmic comparison of DNA sequence motifs is a problem in bioinformatics that has received increased attention during the last years. Its main applications concern characterization of potentially novel motifs and clustering of a motif collection in order to remove redundancy. Despite growing interest in motif clustering, the question which motif clusters to aim at has so far not been systematically addressed. Here we analyzed motif similarities in a comprehensive set of vertebrate transcription factor classes. For this we developed enhanced similarity scores by inclusion of the information coverage (IC) criterion, which evaluates the fraction of information an alignment covers in aligned motifs. A network-based method enabled us to identify motif clusters with high correspondence to DNA-binding domain phylogenies and prior experimental findings. Based on this analysis we derived a set of motif families representing distinct binding specificities. These motif families were used to train a classifier which was further integrated into a novel algorithm for unsupervised motif clustering. Application of the new algorithm demonstrated its superiority to previously published methods and its ability to reproduce entrained motif families. As a result, our work proposes a probabilistic approach to decide whether two motifs represent common or distinct binding specificities.
Conflict of interest statement
I have read the journal's policy and have the following conflicts: PS is an employee of Biobase GmbH, Germany. AK and EW are employees of geneXplain GmbH, Germany. JB is an employee of Medizinische Hochschule Hannover. There are no patents, products in development, or marketed products to declare. This does not alter the authors' adherence to all the PLOS Computational Biology policies on sharing data and materials, as detailed online in the guide for authors.
Figures
Similar articles
-
Alignment-free clustering of transcription factor binding motifs using a genetic-k-medoids approach.BMC Bioinformatics. 2015 Jan 28;16:22. doi: 10.1186/s12859-015-0450-2. BMC Bioinformatics. 2015. PMID: 25627106 Free PMC article.
-
A novel Bayesian DNA motif comparison method for clustering and retrieval.PLoS Comput Biol. 2008 Feb 29;4(2):e1000010. doi: 10.1371/journal.pcbi.1000010. PLoS Comput Biol. 2008. PMID: 18463706 Free PMC article.
-
CLIMP: Clustering Motifs via Maximal Cliques with Parallel Computing Design.PLoS One. 2016 Aug 3;11(8):e0160435. doi: 10.1371/journal.pone.0160435. eCollection 2016. PLoS One. 2016. PMID: 27487245 Free PMC article.
-
A survey of DNA motif finding algorithms.BMC Bioinformatics. 2007 Nov 1;8 Suppl 7(Suppl 7):S21. doi: 10.1186/1471-2105-8-S7-S21. BMC Bioinformatics. 2007. PMID: 18047721 Free PMC article. Review.
-
Discovering sequence motifs.Methods Mol Biol. 2008;452:231-51. doi: 10.1007/978-1-60327-159-2_12. Methods Mol Biol. 2008. PMID: 18566768 Review.
Cited by
-
Transposable elements modulate human RNA abundance and splicing via specific RNA-protein interactions.Genome Biol. 2014 Dec 3;15(12):537. doi: 10.1186/s13059-014-0537-5. Genome Biol. 2014. PMID: 25572935 Free PMC article.
-
Bioinformatics Approaches for Determining the Functional Impact of Repetitive Elements on Non-coding RNAs.Methods Mol Biol. 2022;2509:315-340. doi: 10.1007/978-1-0716-2380-0_19. Methods Mol Biol. 2022. PMID: 35796972
-
RSAT matrix-clustering: dynamic exploration and redundancy reduction of transcription factor binding motif collections.Nucleic Acids Res. 2017 Jul 27;45(13):e119. doi: 10.1093/nar/gkx314. Nucleic Acids Res. 2017. PMID: 28591841 Free PMC article.
-
DynaMIT: the dynamic motif integration toolkit.Nucleic Acids Res. 2016 Jan 8;44(1):e2. doi: 10.1093/nar/gkv807. Epub 2015 Aug 7. Nucleic Acids Res. 2016. PMID: 26253738 Free PMC article.
-
GSMC: Combining Parallel Gibbs Sampling with Maximal Cliques for Hunting DNA Motif.J Comput Biol. 2017 Dec;24(12):1243-1253. doi: 10.1089/cmb.2017.0100. Epub 2017 Nov 8. J Comput Biol. 2017. PMID: 29116820 Free PMC article.
References
Publication types
MeSH terms
Substances
Grants and funding
LinkOut - more resources
Full Text Sources
Other Literature Sources
Research Materials
