

Temporal system-level organization of the switch from glycolytic to gluconeogenic operation in yeast
- PMID: 23549479
- PMCID: PMC3693829
- DOI: 10.1038/msb.2013.11
Temporal system-level organization of the switch from glycolytic to gluconeogenic operation in yeast
Abstract
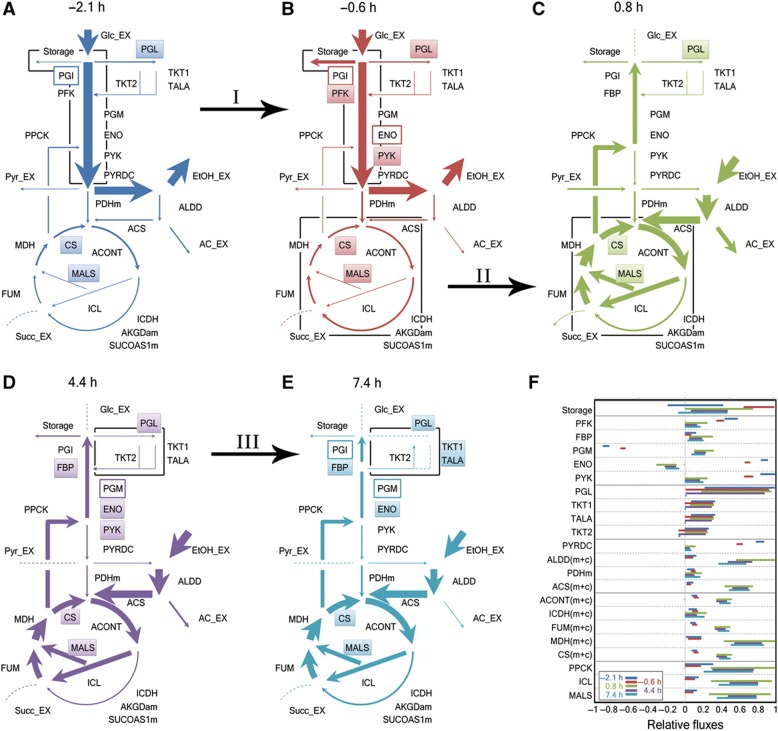
The diauxic shift in Saccharomyces cerevisiae is an ideal model to study how eukaryotic cells readjust their metabolism from glycolytic to gluconeogenic operation. In this work, we generated time-resolved physiological data, quantitative metabolome (69 intracellular metabolites) and proteome (72 enzymes) profiles. We found that the diauxic shift is accomplished by three key events that are temporally organized: (i) a reduction in the glycolytic flux and the production of storage compounds before glucose depletion, mediated by downregulation of phosphofructokinase and pyruvate kinase reactions; (ii) upon glucose exhaustion, the reversion of carbon flow through glycolysis and onset of the glyoxylate cycle operation triggered by an increased expression of the enzymes that catalyze the malate synthase and cytosolic citrate synthase reactions; and (iii) in the later stages of the adaptation, the shutting down of the pentose phosphate pathway with a change in NADPH regeneration. Moreover, we identified the transcription factors associated with the observed changes in protein abundances. Taken together, our results represent an important contribution toward a systems-level understanding of how this adaptation is realized.
Conflict of interest statement
The authors declare that they have no conflict of interest.
Figures


Similar articles
-
The combination of NAD+-dependent deacetylase gene deletion and the interruption of gluconeogenesis causes increased glucose metabolism in budding yeast.PLoS One. 2018 Mar 26;13(3):e0194942. doi: 10.1371/journal.pone.0194942. eCollection 2018. PLoS One. 2018. PMID: 29579121 Free PMC article.
-
Changes in the metabolome of Saccharomyces cerevisiae associated with evolution in aerobic glucose-limited chemostats.FEMS Yeast Res. 2005 Feb;5(4-5):419-30. doi: 10.1016/j.femsyr.2004.11.008. FEMS Yeast Res. 2005. PMID: 15691747
-
Dynamics of glycolytic regulation during adaptation of Saccharomyces cerevisiae to fermentative metabolism.Appl Environ Microbiol. 2008 Sep;74(18):5710-23. doi: 10.1128/AEM.01121-08. Epub 2008 Jul 18. Appl Environ Microbiol. 2008. PMID: 18641162 Free PMC article.
-
Transcriptional regulation in yeast during diauxic shift and stationary phase.OMICS. 2010 Dec;14(6):629-38. doi: 10.1089/omi.2010.0069. Epub 2010 Sep 23. OMICS. 2010. PMID: 20863251 Free PMC article. Review.
-
Control of glycolytic gene expression in the budding yeast (Saccharomyces cerevisiae).Curr Genet. 1995 Dec;29(1):1-9. doi: 10.1007/BF00313187. Curr Genet. 1995. PMID: 8595651 Review. No abstract available.
Cited by
-
Glycolysis/gluconeogenesis specialization in microbes is driven by biochemical constraints of flux sensing.Mol Syst Biol. 2022 Jan;18(1):e10704. doi: 10.15252/msb.202110704. Mol Syst Biol. 2022. PMID: 34994048 Free PMC article.
-
Transcriptome Kinetics of Saccharomyces cerevisiae in Response to Viral Killer Toxin K1.Front Microbiol. 2019 May 16;10:1102. doi: 10.3389/fmicb.2019.01102. eCollection 2019. Front Microbiol. 2019. PMID: 31156606 Free PMC article.
-
Regulation Systems of Bacteria such as Escherichia coli in Response to Nutrient Limitation and Environmental Stresses.Metabolites. 2013 Dec 30;4(1):1-35. doi: 10.3390/metabo4010001. Metabolites. 2013. PMID: 24958385 Free PMC article.
-
Few regulatory metabolites coordinate expression of central metabolic genes in Escherichia coli.Mol Syst Biol. 2017 Jan 3;13(1):903. doi: 10.15252/msb.20167402. Mol Syst Biol. 2017. PMID: 28049137 Free PMC article.
-
Bacterial persistence is an active σS stress response to metabolic flux limitation.Mol Syst Biol. 2016 Sep 21;12(9):882. doi: 10.15252/msb.20166998. Mol Syst Biol. 2016. PMID: 27655400 Free PMC article.
References
-
- Boy-Marcotte E, Tadi D, Perrot M, Boucherie H, Jacquet M (1996) High cAMP levels antagonize the reprogramming of gene expression that occurs at the diauxic shift in Saccharomyces cerevisiae. Microbiology 142: Part 3459–467 - PubMed
Publication types
MeSH terms
Substances
LinkOut - more resources
Full Text Sources
Other Literature Sources
Molecular Biology Databases
