

Gene expression drives local adaptation in humans
- PMID: 23539138
- PMCID: PMC3698502
- DOI: 10.1101/gr.152710.112
Gene expression drives local adaptation in humans
Abstract
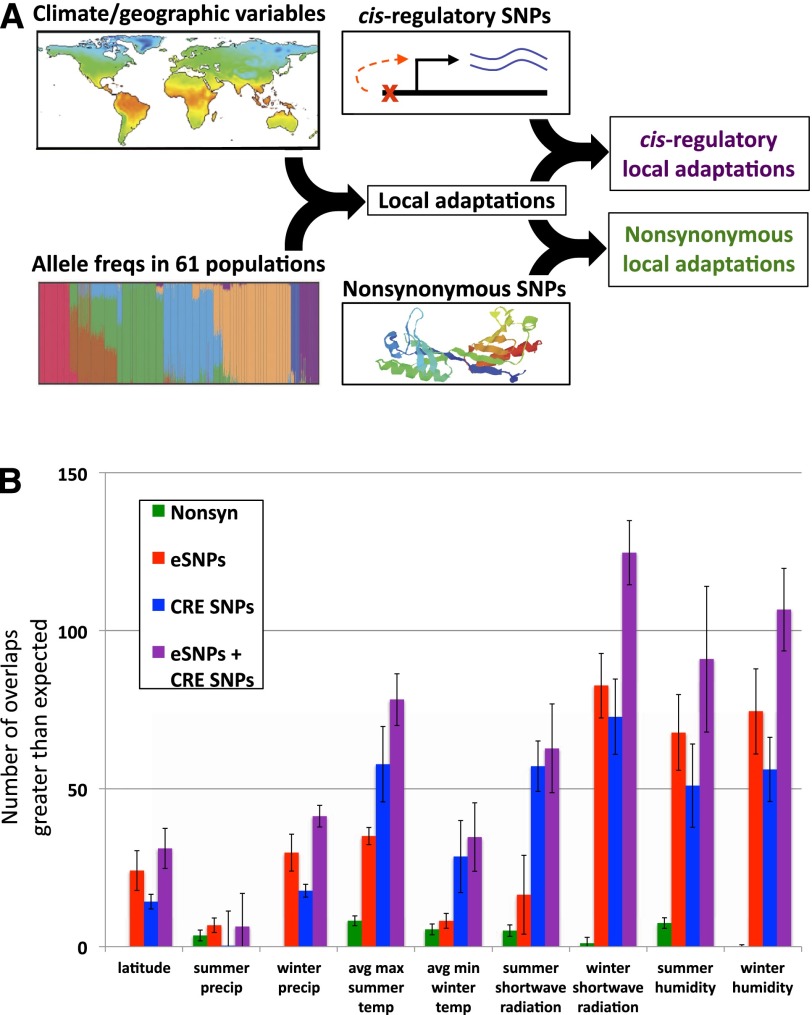
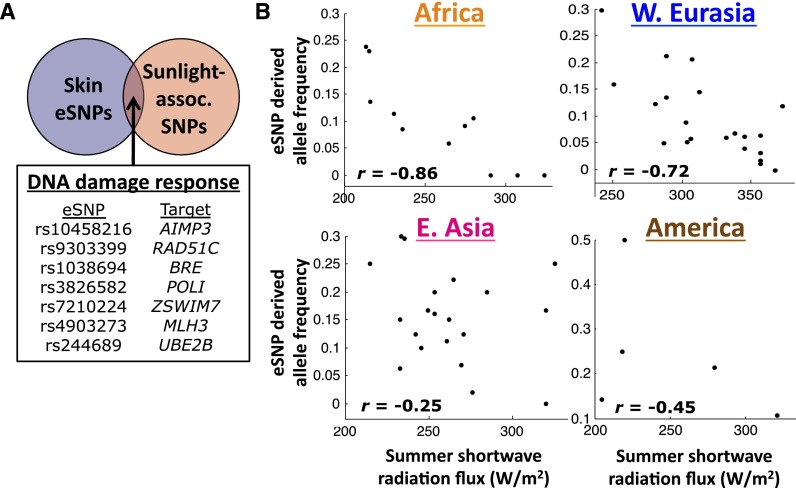
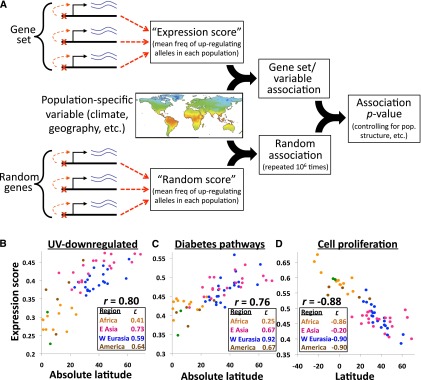
The molecular basis of adaptation--and, in particular, the relative roles of protein-coding versus gene expression changes--has long been the subject of speculation and debate. Recently, the genotyping of diverse human populations has led to the identification of many putative "local adaptations" that differ between populations. Here I show that these local adaptations are over 10-fold more likely to affect gene expression than amino acid sequence. In addition, a novel framework for identifying polygenic local adaptations detects recent positive selection on the expression levels of genes involved in UV radiation response, immune cell proliferation, and diabetes-related pathways. These results provide the first examples of polygenic gene expression adaptation in humans, as well as the first genome-scale support for the hypothesis that changes in gene expression have driven human adaptation.
Figures
Similar articles
-
Polygenic cis-regulatory adaptation in the evolution of yeast pathogenicity.Genome Res. 2012 Oct;22(10):1930-9. doi: 10.1101/gr.134080.111. Epub 2012 May 29. Genome Res. 2012. PMID: 22645260 Free PMC article.
-
Changes in selective pressures associated with human population expansion may explain metabolic and immune related pathways enriched for signatures of positive selection.BMC Genomics. 2016 Jul 21;17:504. doi: 10.1186/s12864-016-2783-2. BMC Genomics. 2016. PMID: 27444955 Free PMC article.
-
Signatures of environmental genetic adaptation pinpoint pathogens as the main selective pressure through human evolution.PLoS Genet. 2011 Nov;7(11):e1002355. doi: 10.1371/journal.pgen.1002355. Epub 2011 Nov 3. PLoS Genet. 2011. PMID: 22072984 Free PMC article.
-
Approaches to understanding adaptations of skin color variation by detecting gene-environment interactions.Expert Rev Mol Diagn. 2010 Nov;10(8):987-91. doi: 10.1586/erm.10.90. Expert Rev Mol Diagn. 2010. PMID: 21080816 Review.
-
Signs of adaptation to local pH conditions across an environmental mosaic in the California Current Ecosystem.Integr Comp Biol. 2013 Nov;53(5):857-70. doi: 10.1093/icb/ict094. Epub 2013 Aug 26. Integr Comp Biol. 2013. PMID: 23980118 Review.
Cited by
-
Whole-genome analysis reveals distinct adaptation signatures to diverse environments in Chinese domestic pigs.J Anim Sci Biotechnol. 2024 Jul 10;15(1):97. doi: 10.1186/s40104-024-01053-0. J Anim Sci Biotechnol. 2024. PMID: 38982489 Free PMC article.
-
To live or let die? Epigenetic adaptations to climate change-a review.Environ Epigenet. 2024 Jul 4;10(1):dvae009. doi: 10.1093/eep/dvae009. eCollection 2024. Environ Epigenet. 2024. PMID: 39139701 Free PMC article. Review.
-
Cell-type-specific cis-regulatory divergence in gene expression and chromatin accessibility revealed by human-chimpanzee hybrid cells.Elife. 2024 Feb 15;12:RP89594. doi: 10.7554/eLife.89594. Elife. 2024. PMID: 38358392 Free PMC article.
-
Evolutionary and Medical Consequences of Archaic Introgression into Modern Human Genomes.Genes (Basel). 2018 Jul 18;9(7):358. doi: 10.3390/genes9070358. Genes (Basel). 2018. PMID: 30022013 Free PMC article. Review.
-
Adaptive eQTLs reveal the evolutionary impacts of pleiotropy and tissue-specificity while contributing to health and disease.HGG Adv. 2021 Dec 24;3(1):100083. doi: 10.1016/j.xhgg.2021.100083. eCollection 2022 Jan 13. HGG Adv. 2021. PMID: 35047867 Free PMC article.
References
-
- Barker D, Dixon K, Medrano EE, Smalara D, Im S, Mitchell D, Babcock G, Abdel-Malek ZA 1995. Comparison of the responses of human melanocytes with different melanin contents to ultraviolet B irradiation. Cancer Res 55: 4041–4046 - PubMed
Publication types
MeSH terms
Grants and funding
LinkOut - more resources
Full Text Sources
Other Literature Sources