. 2013 May 2;88(5):112.
doi: 10.1095/biolreprod.112.106104. Print 2013 May.

Transgenerational effects of di-(2-ethylhexyl) phthalate on testicular germ cell associations and spermatogonial stem cells in mice

Affiliations

Transgenerational effects of di-(2-ethylhexyl) phthalate on testicular germ cell associations and spermatogonial stem cells in mice

Timothy J Doyle et al. Biol Reprod. .

Abstract

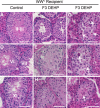
Recent evidence has linked human phthalate exposure to abnormal reproductive and hormonal effects. Phthalates are plasticizers that confer flexibility and transparency to plastics, but they readily contaminate the body and the environment. In this study, timed pregnant CD1 outbred mice were treated with di-(2-ethylhexyl) phthalate (DEHP) from Embryonic Day 7 (E7) to E14. The subsequent generation (F1) offspring were then bred to produce the F2, F3, and F4 offspring, without any further DEHP treatment. This exposure scheme disrupted testicular germ cell association and decreased sperm count and motility in F1 to F4 offspring. By spermatogonial transplantation techniques, the exposure scheme also disrupted spermatogonial stem cell (SSC) function of F3 offspring. The W/W(V) recipient testes transplanted with F3 offspring germ cells from the DEHP-treated group had a dramatically lower percentage of donor germ cell-derived spermatogenic recovery in seminiferous tubules when compared to the recipient testes transplanted with CD1 control germ cells. Further characterization showed that the major block of donor germ cell-derived spermatogenesis was before the appearance of undifferentiated spermatogonia. Interestingly, the testes transplanted with the F3 offspring germ cells from the DEHP-treated group, when regenerated, replicated testis morphology similar to that observed in the testes from the F1 to F3 offspring of the DEHP-treated group, suggesting that the germ cell disorganization phenotype originates from the stem cells of F3 offspring. In conclusion, embryonic exposure to DEHP was found to disrupt testicular germ cell organization and SSC function in a transgenerational manner.

Keywords: DEHP; environmental contaminants and toxicants; male germ cells; spermatogenesis; spermatogonial stem cells; testis; transgenerational.


Figures
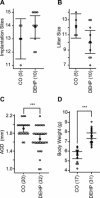
FIG. 1
FIG. 1
Implantation sites and litter size for F0 dams, and AGDs and body weights of F1 offspring. Time-pregnant dams were treated with 500 mg/kg body weight/day DEHP or corn oil vehicle (CO) from E7 to E14. Individual value plots are shown for the number of implantation sites in F0 dams (A), the number of live pups born per litter for F0 dams (B), AGD measurements in millimeters for F1 pups at P1 (C), and the body weights in grams for F1 pups at P10 (D) from DEHP-treated or corn oil vehicle (CO)-treated dams. The number (n) in the parentheses indicates the number of dams for A and B and the number of male offspring for C and D. Values are mean ± SEM. Pooled t-tests were conducted for the control and DEHP values; ***P < 0.001, no asterisk indicates P > 0.05.
FIG. 2
FIG. 2
Male pubertal onset of F1, F2, and F3 male offspring. The age of male pups was noted when prepuce detachment occurred. The average age of pubertal onset for F1, F2, and F3 male offspring in the vehicle control group was P24.7. Changes in days of the pubertal onset for F1 (A), F2 (B), and F3 (C) male pups from the corn oil vehicle (CO) and DEHP groups for the maternal (M), paternal (P), and double-cross (DC) lines were graphed. The number (n) in the parentheses indicates the number of male offspring for the CO and DEHP groups. Values are mean ± SEM. Pooled t-tests were conducted for the control and DEHP values; ***P < 0.001, *P < 0.05, no asterisk indicates P > 0.05.
FIG. 3
FIG. 3
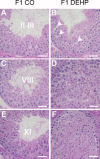
Testicular cross sections from F1 offspring. Hematoxylin and eosin-stained testicular cross sections for F1 offspring at P120 after embryonic exposure to corn oil vehicle (CO; A, C, and E) and DEHP (B, D, and F). The stages of seminiferous epithelial cycle are noted in control sections (A, C, and E). Arrowheads indicate small vacuoles (B). Bar = 50 μm. Photomicrographs are representative of n ≥ 6 offspring for both the vehicle control and DEHP groups from two sets of embryonic exposures.
FIG. 4
FIG. 4
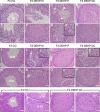
Testicular cross sections from F2, F3, and F4 offspring at P120. Hematoxylin and eosin-stained testicular cross sections for the F2 and F3 offspring at P120 in the control vehicle group (CO; A, E, I, and M) and DEHP group in the maternal (M; B, F, J, and N), paternal (P; C, G, K, and O), and double-cross (DC; D, H, L, and P) lines and for the F4 offspring at P120 in the control vehicle group (Q and R) and DEHP group (S and T) in the double-cross line (DC) are shown. The stages of seminiferous epithelial cycle are noted in control sections (A, E, I, M, Q, and R). Arrowheads indicate areas where small vacuoles were observed. Arrows indicate areas where large vacuoles were observed. Oblong circles are magnified in g‘, j‘, l‘, and o‘, showing areas with germ cells missing. Bar = 50 μm. Photomicrographs are representative of n ≥ 6 offspring for the F2 and F3 generations and three breeding lines from two sets of embryonic exposures and n ≥ 3 offspring for the F4 generation.
FIG. 5
FIG. 5
Testicular and epididymal cross sections from F4 offspring at P360. Hematoxylin and eosin-stained testicular and epididymal cross sections for the F4 offspring at P360 in the control vehicle group (CO; A, D, and G) and DEHP group in the double-cross line (DC; B, C, E, F, H, and, I) are shown. The stages of seminiferous epithelial cycle are noted in control sections (A, D, and G). Arrowheads indicate areas where small vacuoles were observed. Arrows indicate areas where large vacuoles were observed. Boxed areas are magnified in b‘ and f‘, showing multinucleated cells. Hematoxylin and eosin-stained epididymal cauda cross sections for the F4 offspring at P360 in the CO group (J) and DEHP group (K and L). Bar = 50 μm. Photomicrographs are representative of n ≥ 3 offspring.
FIG. 6
FIG. 6
Fold changes in abnormal tubules for F1–F3 offspring at P120 and F4 offspring at P360. Moderately and severely disorganized seminiferous tubules were counted and the percentage abnormality calculated by counting the total number of tubules on three or four sections spaced 50 μm apart per testis from n ≥ 3 offspring (≥9–12 sections). The fold change for the DEHP group was calculated by the percentage average of abnormal tubules in the control vehicle group (CO) set to 1. The fold changes in abnormal tubules were graphed for the F1 offspring at P120 (A); for the F2 and F3 offspring at P120 from the maternal (M), paternal (P), and double-cross (DC; B and C) lines; and for the F4 offspring at P360 from DC (D). Fold change values are means ± SEM. Pooled t-tests were conducted for the control and DEHP values; ***P < 0.001, **P < 0.01, *P < 0.05, no asterisk indicates P > 0.05.
FIG. 7
FIG. 7
Fold changes in apoptotic tubules in F1–F3 offspring at P120. TUNEL assay was performed on three or four sections spaced 50 μm apart per testis from n ≥ 3 offspring (≥9–12 sections). Tubules with four or more apoptotic cells and the total number of tubules were counted to calculate the percentage apoptosis. Examples of tubules with apoptotic cells for the control (A) and DEHP (B and C) groups are shown. Arrow in C indicates abnormal seminiferous tubule with sloughed germ cells and no TUNEL-positive cells. The fold change for DEHP group was calculated by the percentage average of apoptotic tubules in the control vehicle group (CO) set to 1. The fold changes in apoptotic tubules were graphed for the F1 offspring at P120 (D) and for the F2 and F3 offspring at P120 from the maternal (M), paternal (P), and double-cross (DC; E and F) lines. Fold change values are means ± SEM. Pooled t-tests were conducted for the control and DEHP values and there were no significant differences at P < 0.05. Bars in AC = 100 μm.
FIG. 8
FIG. 8
Epididymal sperm count from F1–F4 offspring at P120. Epididymal sperm counts were performed on caudal sperm from n ≥ 6 offspring for the F1, F2, F3, and F4 generations. The percentage change in sperm count for DEHP group was calculated against the control group (CO) sperm count set to 100%. The percentage sperm count were graphed for the F1 (A), F2 (B), F3 (C) and F4 (D) offspring at P120 from the maternal (M), paternal (P), and double-cross (DC) lines. The percentage age values are means ± SEM. Pooled t-tests were conducted for the control and DEHP values; ***P < 0.001, **P < 0.01, *P < 0.05, no asterisk indicates P > 0.05.
FIG. 9
FIG. 9
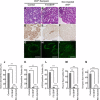
W/WV recipient mice injected with donor germ cells from F3 offspring of DEHP-treated F0 dams. Testicular cross sections from W/WV recipients injected with germ cells from untreated CD1 control mice (A, D, and G), germ cells from F3 offspring derived from DEHP-exposed F0 dams (B, E, and H), and a noninjected W/WV control testis (C, F, and I) were stained with hematoxylin and eosin (AC) or immunostained using anti-DDX4 antibody (DF) or anti-γH2AX antibody (GI). To quantify the extent of recovery, tubules containing donor-derived germ cells (J), tubules with 2 or more layers of anti-DDX4 immunostain (K), tubules with anti-γH2AX immunostain (L), tubules with round spermatids (M), and tubules with elongated spermatids (N) were counted and graphed. Values are means ± SEM for n ≥ 3 offspring and for two to six sections separated by 50 μm per testis. Pooled t-tests were conducted for the control and DEHP values; ***P < 0.001, **P < 0.01. Bars = 400 μm (AF) and 50 μm (G–I). The negative controls showed no staining with only secondary antibody present, but without γH2AX or DDX4 primary antibodies (data not shown).
FIG. 10
FIG. 10
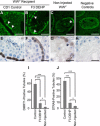
W/WV recipient testicular tubules containing undifferentiated, differentiated, and premeiotic germ cells. Immunofluorescence and immunohistochemistry were performed using an anti-DMRT1 antibody (AD) and an anti-STRA8 antibody (EH), respectively, on testicular sections from W/WV mice injected with germ cells from untreated control CD1 mice (A and E) and germ cells from F3 offspring of DEHP-treated F0 dams (B and F), and noninjected W/WV control mice (C and G). Anti-DMRT1 antibody immunostains undifferentiated spermatogonia strongly (examples shown by brightly fluorescent cells marked by white arrowheads in A, B, and C). Using Adobe Photoshop CS (Adobe Systems Inc., San Jose, CA) the Alexa-555 color (red) was postprocessed to give a green color for better visualization. Anti-STRA8 antibody immunostains differentiated spermatogonia and premeiotic spermatocytes (examples indicated by brown stained cell nuclei in E, F, and G). Negative staining of the secondary antibody (negative controls) only on testis sections for anti-DMRT1 antibody and anti-STRA8 antibody did not show any staining (D and H). Bars = 50 μm (AD) and 20 μm (EH). Photomicrographs are representative of n ≥ 3 animals. To quantify, DMRT1-positive tubules containing brightly stained undifferentiated spermatogonia (I) and STRA8-positive tubules containing differentiated spermatogonia and premeiotic spermatocytes (J) were counted as well as the total tubules. Values are percentage means ± SEM from n ≥ 3 animals and two to six sections per testis spaced apart by 50 μm. Pooled t-tests were conducted for the control and DEHP values; ***P < 0.001, *P < 0.05 (I and J).
FIG. 11
FIG. 11
Morphology of recovered tubules in W/WV mice injected with germ cells from F3 offspring of DEHP-exposed F0 dams. Testicular cross sections from W/WV recipients injected with germ cells from untreated CD1 control mice (A, D, and G), showing normal stages of seminiferous epithelium, and germ cells from F3 offspring from DEHP-exposed F0 dams (B, C, E, F, H, and I), showing abnormal testicular morphology such that the stages of the seminiferous epithelium could not be assigned. Arrows indicate multinucleated cells. Bar = 50 μm. Photomicrographs are representative of n ≥ 3 animals.

Similar articles

Cited by

References

    1. Halden RU. Plastics and health risks. Annu Rev Public Health 2010; 31: 179 194. - PubMed
    1. CERHR. NTP-CERHR Monograph on the Potential Human Reproductive and Developmental Effects of Di (Ethylhexyl) Phthalate (DEHP). Research Triangle Park, North Carolina: National Institutes of Health; 2006: i III76. - PubMed
    1. Silva MJ, Barr DB, Reidy JA, Malek NA, Hodge CC, Caudill SP, Brock JW, Needham LL, Calafat AM. Urinary levels of seven phthalate metabolites in the U.S. population from the National Health and Nutrition Examination Survey (NHANES) 1999–2000. Environ Health Perspect 2004; 112: 331 338. - PMC - PubMed
    1. Koch HM, Calafat AM. Human body burdens of chemicals used in plastic manufacture. Philos Trans R Soc Lond B Biol Sci 2009; 364: 2063 2078. - PMC - PubMed
    1. Hauser R, Meeker JD, Singh NP, Silva MJ, Ryan L, Duty S, Calafat AM. DNA damage in human sperm is related to urinary levels of phthalate monoester and oxidative metabolites. Hum Reprod 2007; 22: 688 695. - PubMed

Publication types

MeSH terms