Loading [MathJax]/jax/output/PreviewHTML/jax.js
Skip to main page content
U.S. flag

An official website of the United States government

Access keys NCBI Homepage MyNCBI Homepage Main Content Main Navigation
. 2013 Mar 27;33(13):5626-37.
doi: 10.1523/JNEUROSCI.3659-12.2013.

Nitric oxide synthesis and cGMP production is important for neurite growth and synapse remodeling after axotomy

Affiliations

Nitric oxide synthesis and cGMP production is important for neurite growth and synapse remodeling after axotomy

Ria M Cooke et al. J Neurosci. .

Abstract

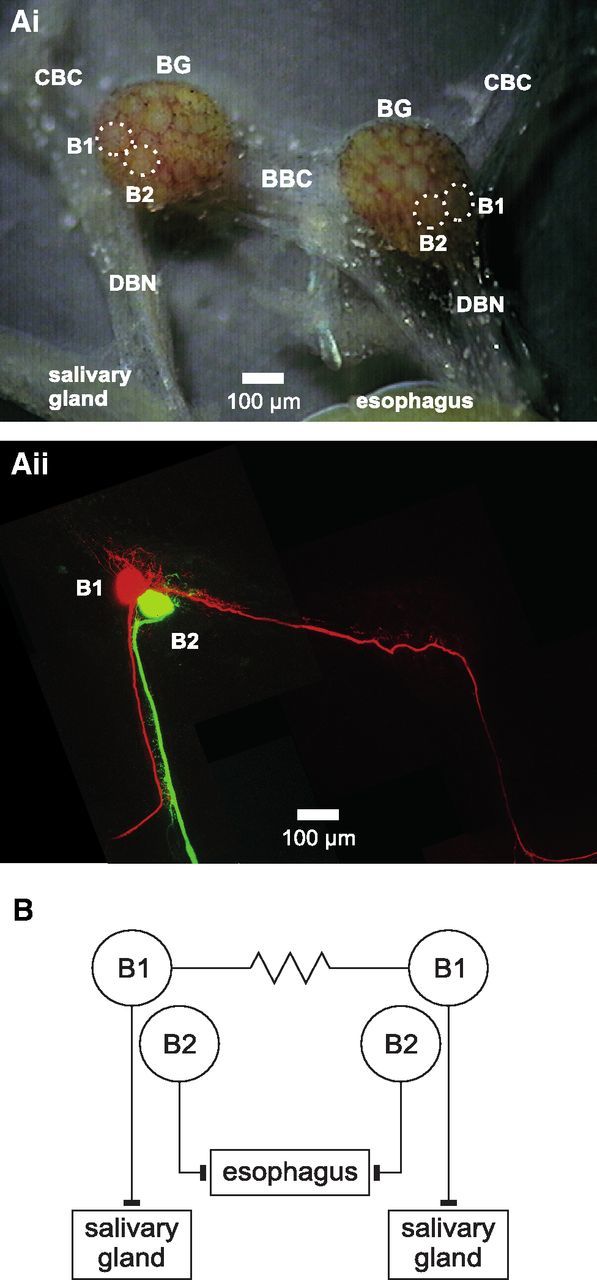
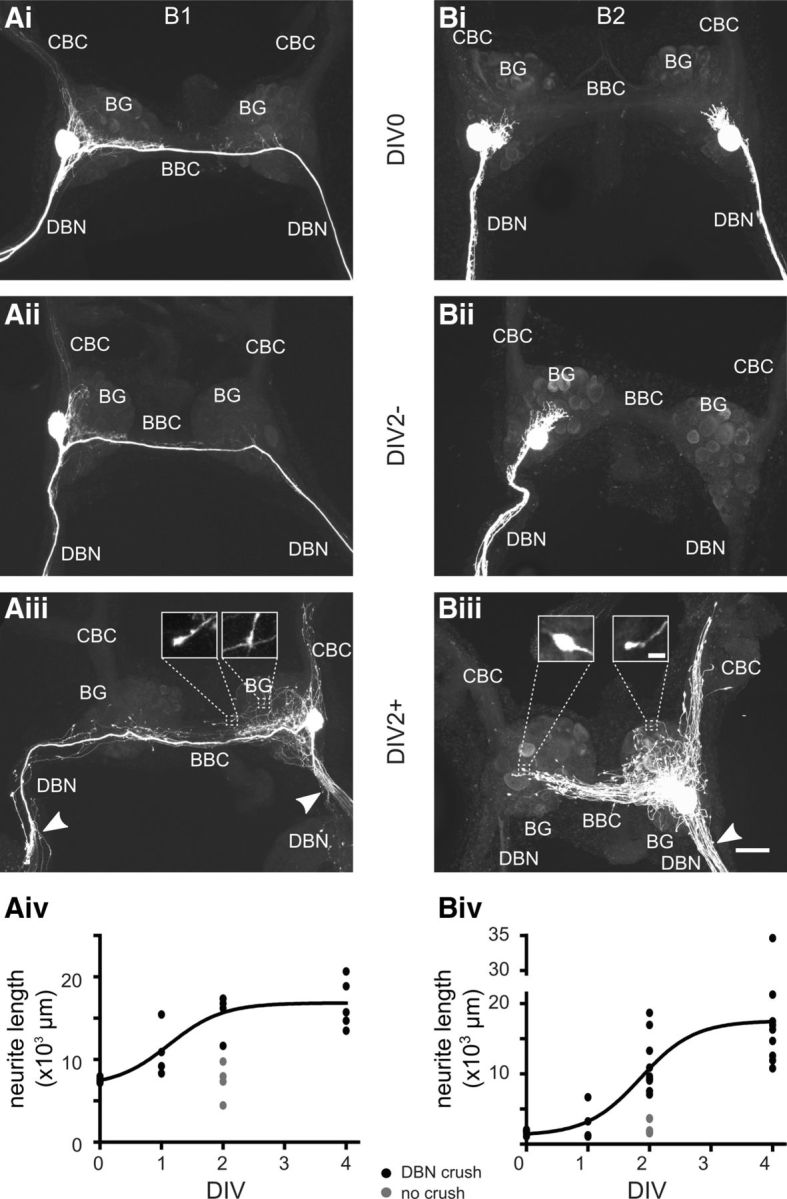
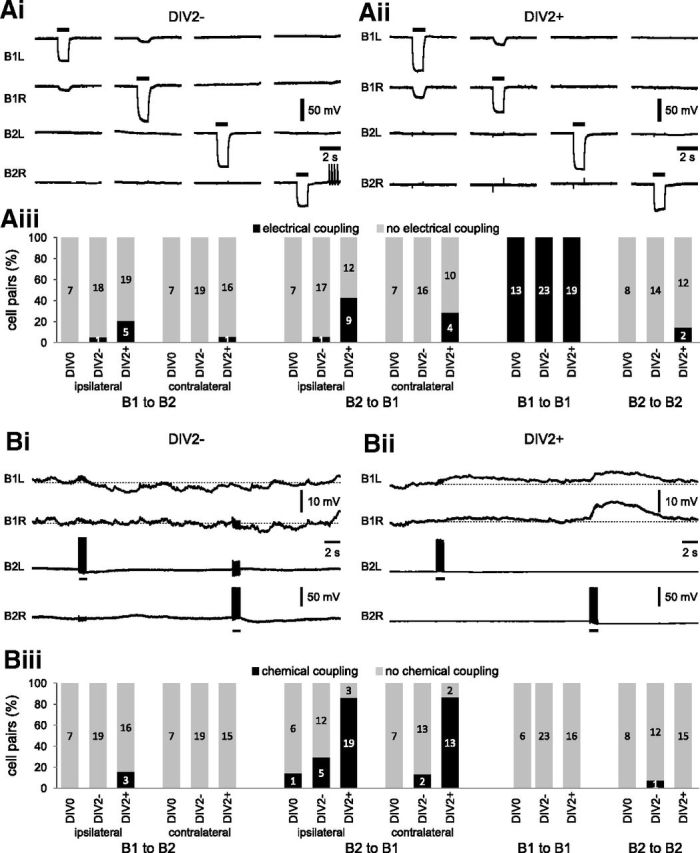
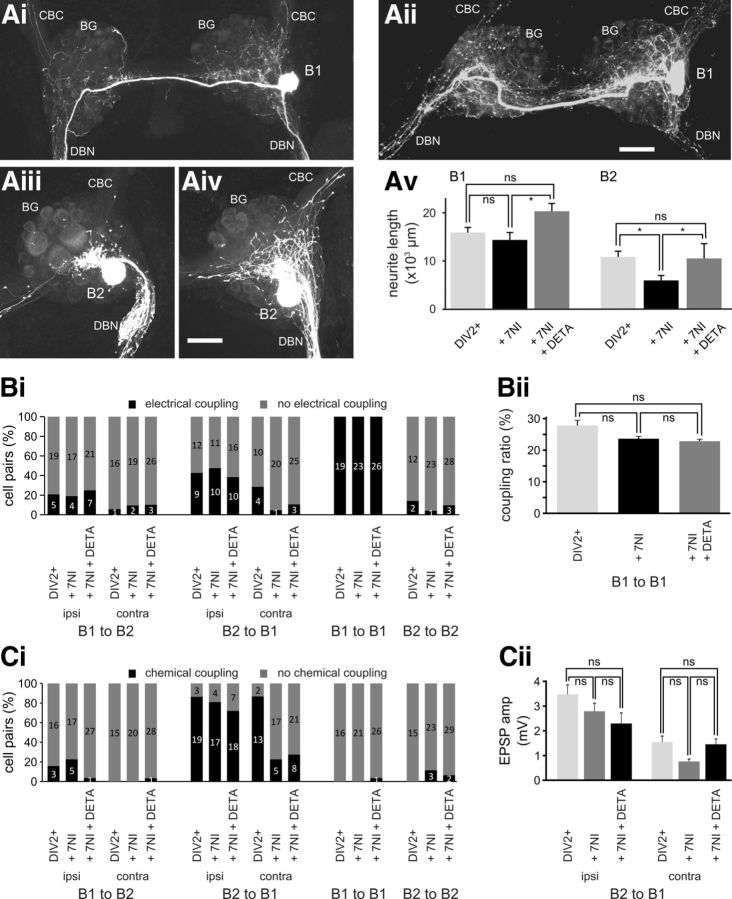
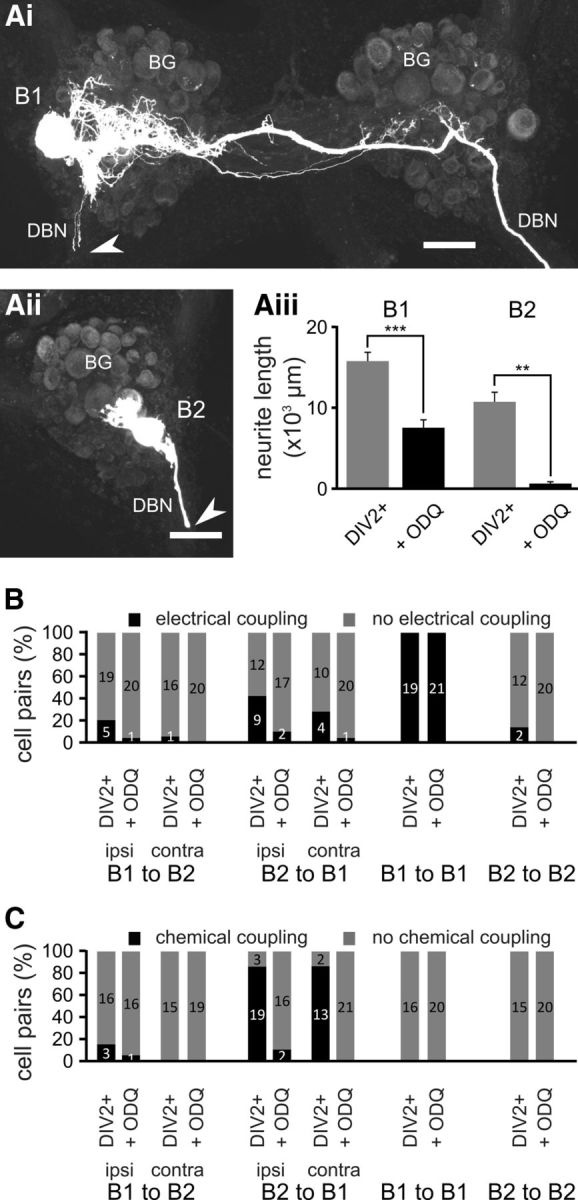
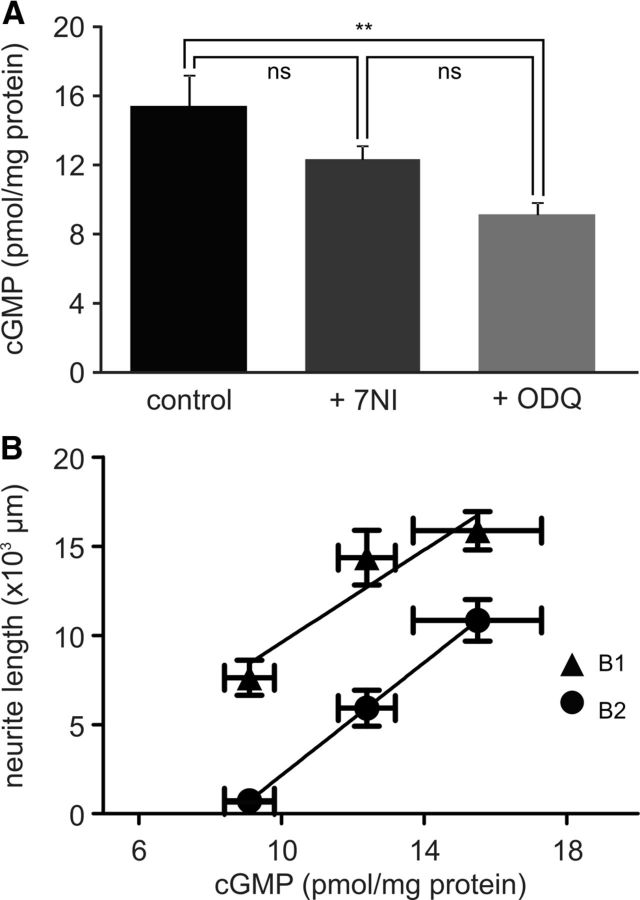
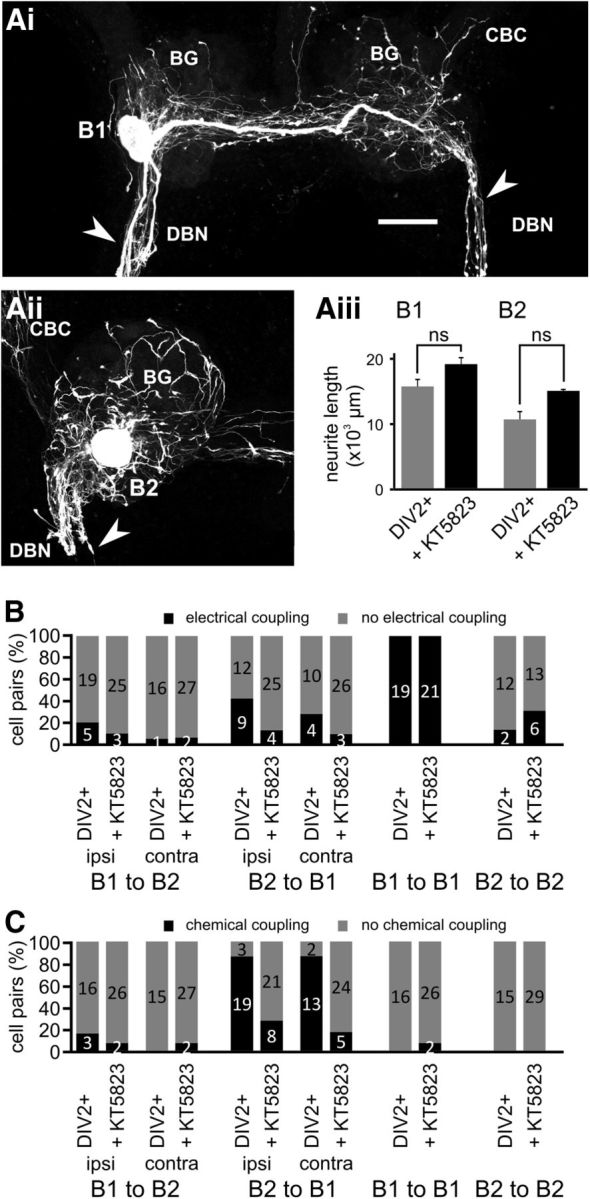
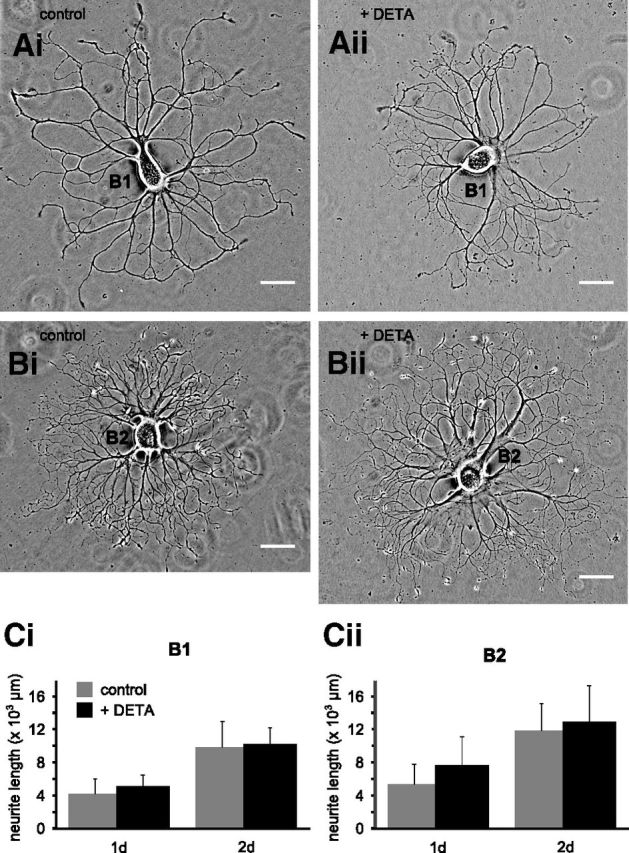
Nitric oxide (NO) is an important signaling molecule with a variety of functions in the CNS, including a potential role in modulating neuronal growth and synapse formation. In the present study, we used tractable, identified neurons in the CNS of the pond snail Lymnaea stagnalis to study the role of endogenous NO signaling in neuronal growth and synaptic remodeling after nerve injury. Axonal damage of L. stagnalis neurons B1 and B2 induces extensive central growth of neurites that is accompanied by changes in existing electrical connections, the transient formation of novel electrical connections, and the formation of a novel excitatory chemical synapse from B2 to B1 neurons. Partial chronic inhibition of endogenous NO synthesis reduces neurite growth in NO-synthase-expressing B2, but has only minor effects on NOS-negative B1 neurons. Chronic application of an NO donor while inhibiting endogenous NO synthesis rescues neurite extension in B2 neurons and boosts growth of B1 neurons. Blocking soluble guanylate cyclase activity completely suppresses neurite extension and synaptic remodeling after nerve crush, demonstrating the importance of cGMP in these processes. Interestingly, inhibition of cGMP-dependent protein kinase only suppresses chemical synapse formation without effects on neuronal growth and electrical synapse remodeling. We conclude that NO signaling via cGMP is an important modulator of both neurite growth and synaptic remodeling after nerve crush. However, differential effects of cGMP-dependent protein kinase inhibition on neurite growth and synaptic remodeling suggest that these effects are mediated by separate signaling pathways.


Figures

Figure 1.
Figure 1.
Anatomy and synaptic connectivity of L. stagnalis B1 and B2 neurons. Ai, Micrograph of isolated BGs showing soma position of B1 and B2 neurons (outline marked by dotted lines). Aii, Maximum-intensity Z projection of two-photon laser scanning image of the BGs shown in Ai after intracellular injection of a B1 neuron with Alexa Fluor 568 and a B2 neuron with Alexa Fluor 488. B, Schematic diagram showing the electrical coupling between the left and right B1 neurons and the innervation of the salivary glands by the B1 neurons and the esophagus by the B2 neurons. BBC indicates buccal-buccal commissure; CBC, cerebral-buccal connective.
Figure 2.
Figure 2.
Axonal-injury-induced neurite growth in buccal neurons B1 and B2. Maximum intensity Z projections of confocal images of fluorescently labeled B1 (AiAiii) and B2 neurons (BiBiii) are shown. Ai, Bi, B1 and B2 neurons (both the left and right B2 neuron were labeled) in acutely isolated BGs (DIV0). Aii, Bii, Single B1 and B2 neurons in BGs that were maintained in tissue culture for 2 d without crush of the DBNs (DBN; DIV2−). Aiii, Biii, Single B1 and B2 neurons in BGs in which DBNs were crushed shortly after dissection and subsequently maintained in tissue culture for 2 d (DIV2+). The sites of DBN crushes are indicated by white arrowheads. Note the extensive network of central neurites. Inserts: Higher-magnification images of the bulb-like structures at neurite tips. Aiv, Biv, Quantitative analysis of total neurite length for B1 (Aiv) and B2 neurons (Biv) at different time points. The growth data for the DIV0, DIV1+, DIV2+, and DIV4+ groups (black circles) were fitted using a sigmoid function, Y = min + , where T = 1.1 ± 0.3 d (r2 = 0.75) for B1 neurons and T = 1.9 ± 0.2 d (r2 = 0.68) for B2 neurons. Gray circles show measurements for the DIV2− group for comparison. CBC indicates cerebral-buccal connective; BBC, buccal-buccal commissure. Scale bars in AiAiii, BiBiii, 100 μm; scale bars for inserts in Aiii, Biii, 10 μm.
Figure 3.
Figure 3.
Axonal injury causes changes in synaptic coupling between B1 and B2 neurons. Electrophysiological records from B1 and B2 neurons to test for changes in electrical coupling (Ai,Aii) and chemical coupling (Bi,Bii) caused by axonal injury. Ai, Aii, Simultaneous intracellular records from the left and right B1 and B2 neurons in a preparation that was maintained in tissue culture for 2 d without injury to the DBNs (DIV2−) and in a preparation that was maintained in cell culture for 2 d after crushing the DBNs (DIV2+). The injection of negative current pulses (−5 nA, 1 s) into individual neurons to test for electrical coupling is indicated by the horizontal bars above the records. Aiii, Summary chart showing the percentage of specific cell pairs that showed electrical coupling in three experimental groups: acutely isolated BGs (DIV0), BGs maintained in tissue culture for 2 d without DBN crushing (DIV2−), and BG maintained in tissue culture for 2 d after DBN crushing (DIV2+). The numbers inside the bars indicate the n number for each observation. Bi, Bii, Simultaneous intracellular records from the left and right B1 and B2 neurons in a preparation that was maintained in tissue culture for 2 d without injury to the DBNs (DIV2−) and in a preparation that was maintained in cell culture for 2 d after DBN crushing (DIV2+). The injection of bursts of 10 positive current pulses (10 Hz, 20 nA, 20 ms) into B2 neurons to test for chemical coupling is indicated by the horizontal bars below the records. Biii, Summary chart showing the percentage of specific cell pairs that showed chemical coupling in three experimental groups (DIV0, DIV2−, DIV2+) mentioned above. The numbers inside the bars indicate n for each observation.
Figure 4.
Figure 4.
Endogenous NO synthesis affects neuronal growth and synaptic remodeling. Maximum-intensity Z projections of confocal images of fluorescently labeled B1 and B2 neurons 2 d after axonal injury and treatment with 7NI (Ai, B1, Aiii, B2) or treatment with 7NI + DETA (Aii, B1, Aiv, B2). Av, Average total neurite length of B1 and B2 neurons 2 d after axonal injury under control conditions (DIV2+), in the presence of 7NI (+ 7NI), and in the presence of 7NI plus DETA (+ 7NI + DETA). Individual groups were compared using NK tests. *p < 0.05. Bi, Percentage of specific cell pairs showing electrical coupling 2 d after axonal injury under the three experimental conditions outlined above. n is indicated on the bars. Bii, Average coupling ratio between pairs of B1 neurons under the three experimental conditions (DIV2+, + 7NI, + 7NI + DETA) outlined above. Groups were compared using NK tests (n.s. p > 0.05). Ci, Percentage of specific cell pairs showing excitatory chemical coupling 2 d after axonal injury under the three experimental conditions (DIV2+, + 7NI, + 7NI + DETA) outlined above. n is indicated on the bars. Cii, Average peak amplitude of excitatory chemical synapse from B2 to ipsilateral and contralateral B1 neurons under the three experimental conditions (DIV2+, + 7NI, + 7NI + DETA) outlined above. Groups were compared using NK tests (n.s. p > 0.05). Scale bars in Aii, Aiv, 100 μm.
Figure 5.
Figure 5.
Neuronal growth and synaptic remodeling is dependent on sGC activity. Maximum-intensity Z projections of confocal images of fluorescently labeled B1 and B2 neurons 2 d after axonal injury and treatment with ODQ (Ai, B1, Aii, B2). Aiii, Average total neurite length of B1 and B2 neurons 2 d after axonal injury under control conditions (DIV2+) and in the presence of ODQ (+ ODQ). Groups were compared using NK tests: **p < 0.01; ***p < 0.001. B, Percentage of specific cell pairs showing electrical coupling 2 d after axonal injury under the two experimental conditions (DIV2+, + ODQ) outlined above. n is indicated on the bars. C, Percentage of specific cell pairs showing excitatory chemical coupling 2 d after axonal injury under the two experimental conditions (DIV2+, + ODQ) outlined above. n is indicated on the bars. Scale bars in Ai, Aii, 100 μm.
Figure 6.
Figure 6.
cGMP concentration in the isolated CNS. A, Average cGMP concentration measured in isolated whole CNS preparations maintained for 1 d in tissue culture under control conditions (control) or in the presence of either 7NI (0.25 mm) or ODQ (0.4 mm). Groups were compared using an ANOVA followed by NK post hoc tests. *p < 0.05. B, Plot of the average total neurite length of B1 and B2 neurons under the three different conditions (DIV2+, DIV2+/7NI, DIV2+/ODQ) against the average cGMP concentration under equivalent conditions (control, + 7NI, + ODQ).
Figure 7.
Figure 7.
KT5823 inhibits novel chemical synapse formation without affecting neurite extension. Maximum-intensity Z projections of confocal images of fluorescently labeled B1 and B2 neurons 2 d after axonal injury and treatment with KT5823 (Ai, B1, Aii, B2). Aiii, Average total neurite length of B1 and B2 neurons 2 d after axonal injury under control conditions (DIV2+) and in the presence of KT5823 (+ KT5823). Groups were compared using NK tests (n.s. p > 0.05). B, Percentage of specific cell pairs showing electrical coupling 2 d after axonal injury under the two experimental conditions (DIV2+, + KT5823) outlined above. n is indicated on the bars. C, Percentage of specific cell pairs showing excitatory chemical coupling 2 d after axonal injury under the two experimental conditions (DIV2+, + KT5823) outlined above. n is indicated on the bars. Scale bar in Ai, 100 μm.
Figure 8.
Figure 8.
NO does not affect neuronal growth of isolated B1 and B2 neurons in cell culture. Phase-contrast images of individual isolated B1 and B2 neurons after 2 d in cell culture under control conditions (Ai, B1, Bi, B2) and in the presence of DETA (Aii, B1, Bii, B2). Ci, Cii, Average total neurite length of isolated B1 and B2 neurons after 1 and 2 d in cell culture in the absence and presence of DETA. Scale bars in AiBii, 100 μm.

Similar articles

Cited by

References

    1. Benjamin PR, Rose RM. Central generation of bursting in the feeding system of the snail, Lymnaea stagnalis. J Exp Biol. 1979;80:93–118. - PubMed
    1. Benjamin PR, Winlow W. The distribution of 3 wide-acting synaptic inputs to identified neurons in the isolated brain of Lymnaea stagnalis (L) Comp Biochem Phys A. 1981;70:293–307.
    1. Benjamin PR, Rose RM, Slade CT, Lacy MG. Morphology of identified neurones in the buccal ganglia of Lymnaea stagnalis. J Exp Biol. 1979;80:119–135.
    1. Benowitz LI, Carmichael ST. Promoting axonal rewiring to improve outcome after stroke. Neurobiology of Disease. 2010;37:259–266. - PMC - PubMed
    1. Benton JL, Sandeman DC, Beltz BS. Nitric oxide in the crustacean brain: regulation of neurogenesis and morphogenesis in the developing olfactory pathway. Dev Dyn. 2007;236:3047–3060. - PMC - PubMed

Publication types

MeSH terms

LinkOut - more resources