. 2013 Mar 25;14(3):R25.
doi: 10.1186/gb-2013-14-3-r25.

Redistribution of H3K27me3 upon DNA hypomethylation results in de-repression of Polycomb target genes

Redistribution of H3K27me3 upon DNA hypomethylation results in de-repression of Polycomb target genes

James P Reddington et al. Genome Biol. .

Abstract

Background: DNA methylation and the Polycomb repression system are epigenetic mechanisms that play important roles in maintaining transcriptional repression. Recent evidence suggests that DNA methylation can attenuate the binding of Polycomb protein components to chromatin and thus plays a role in determining their genomic targeting. However, whether this role of DNA methylation is important in the context of transcriptional regulation is unclear.

Results: By genome-wide mapping of the Polycomb Repressive Complex 2-signature histone mark, H3K27me3, in severely DNA hypomethylated mouse somatic cells, we show that hypomethylation leads to widespread H3K27me3 redistribution, in a manner that reflects the local DNA methylation status in wild-type cells. Unexpectedly, we observe striking loss of H3K27me3 and Polycomb Repressive Complex 2 from Polycomb target gene promoters in DNA hypomethylated cells, including Hox gene clusters. Importantly, we show that many of these genes become ectopically expressed in DNA hypomethylated cells, consistent with loss of Polycomb-mediated repression.

Conclusions: An intact DNA methylome is required for appropriate Polycomb-mediated gene repression by constraining Polycomb Repressive Complex 2 targeting. These observations identify a previously unappreciated role for DNA methylation in gene regulation and therefore influence our understanding of how this epigenetic mechanism contributes to normal development and disease.


Figures
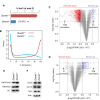
Figure 1
Figure 1
H3K27me3 and H3K4me3 mapping at gene promoters in DNA hypomethylated somatic cells. (A) Global quantification of the 5 mC base by HPLC. Values are 5 mC as a percentage of total C in Dnmt1+/+ and Dnmt1-/- MEFs. Error bars represent standard error of the mean. **P <0.001 by t-test. (B) Density plots showing CpG methylation levels in Dnmt1+/+ and Dnmt1-/- MEFs as measured by RRBS. (C, D) Volcano plots of all promoter H3K27me3 (C) and H3K4me3 (D) ChIP data measured by promoter microarray (ChIP-chip). Difference in normalized average promoter values between Dnmt1+/+ and Dnmt1-/- MEFs (Δlog2(IP/INP)) is plotted against q-value (P-value (two-tailed t-test) corrected for multiple testing by Benjamini-Hochberg method). Promoters that have a difference of <-0.5 or >0.5 and a q-value <0.05 are defined as significantly different. Red points indicate promoters with reduced H3K27me3/H3K4me3 in Dnmt1-/- MEFs (H3K27me3/H3K4me3 down) and blue indicate promoters with increased H3K27me3/H3K4me3 in Dnmt1-/- MEFs (H3K27me3/H3K4me3 up). (E, F) Western blot for histone modifications (E) and core PRC2 components (F) in Dnmt1+/+ and Dnmt1-/- MEFs. mC, methyl-cytosine. KO, knock-out, Dnmt1-/- MEFs. WT, wild-type, Dnmt1+/+ MEFs.
Figure 2
Figure 2
H3K27me3 redistribution in hypomethylated cells is associated with DNA methylation pattern. (A) Density plots showing the methylation of CpGs in Dnmt1+/+ (upper) and Dnmt1-/- (lower) MEFs. The methylation is plotted for all CpGs, CpGs within H3K27me3 down regions and H3K27me3 up regions defined by ChIP-seq. (B) Bisulfite sequencing of selected H3K27me3 down and H3K27me3 up regions in Dnmt1+/+ and Dnmt1-/- MEFs. Filled circles (black) represent 5mCpG and open circles represent CpG. Gaps indicate inconclusive base calling at a CpG site. The overall amount of 5mCpG as a percentage of total CpG in each amplicon is shown adjacent to each image. H3K27me3 down regions represent proximal promoter regions while H3K27me3 up regions represent intragenic or intergenic regions.
Figure 3
Figure 3
H3K27me3 is lost from Polycomb target gene promoters in DNA hypomethylated somatic cells. (A) Scatter plot showing the relationship between H3K27me3 enrichment in Dnmt1+/+ MEFs (x-axis) and the difference in H3K27me3 enrichments between Dnmt1+/+ and Dnmt1-/- MEFs (y-axis) at all promoter regions by ChIP-chip. A llocally weighted scatterplot smoothing line (black) is plotted. The R2 value (Pearson's) is shown alongside the P-value from a Pearson's correlation test. Hox gene promoters are plotted as red points. (B) H3K27me3 ChIP-seq data for regions surrounding Polycomb target genes. Polycomb target genes were defined as the top 10% of gene promoters as ranked by H3K27me3 enrichment (by ChIP-chip) in Dnmt1+/+ MEFs. (C) Top 10 Gene Ontology terms (Biological Process) found to be significantly enriched among H3K27me3 down genes using all genes covered on the microarray as background. The q-value for enrichment of each term is plotted as -log10(q-value). (D, E) ChIP-qPCR for H3K27me3 (D) and Ezh2 (E) in Dnmt1+/+ and Dnmt1-/- MEFs using primers for the promoters of the indicated genes. Enrichment for each immunoprecipitation (IP) is expressed as percentage of DNA in input. Non-specific IgG IP and the Actb promoter are shown as negative controls and the Chdh promoter is shown as a positive control. Error bars indicate ± standard error of the mean of two experiments.
Figure 4
Figure 4
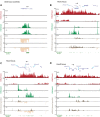
Hox gene clusters are mis-regulated in Dnmt1-/- mouse embryonic fibroblasts. Browser shots from the UCSC genome browser showing H3K27me3 (red) and H3K4me3 (green) ChIP-seq data, and strand-specific mRNA-seq data for the (A) Actb, (B) HoxC, (C) HoxA and (D) HoxD loci in Dnmt1+/+ and Dnmt1-/- MEFs. The position of RefSeq genes (blue) is shown along with the direction of sense transcription for the Hox genes (black arrow). The position of UCSC CpG islands (green) is shown. ChIP-seq data is represented as the number of reads that overlap genomic windows. Note the different scales used for H3K4me3 data. mRNA-seq data is represented as the number of reads that overlap genomic windows (log2) on each strand (above and below the dashed line).
Figure 5
Figure 5
H3K27me3 loss in hypomethylated cells is associated with ectopic gene expression. (A, B) Boxplots displaying the relative expression (log2) of H3K27me3 down genes (red) and all genes (white) between Dnmt1+/+ and Dnmt1-/- MEFs as measured by mRNA-seq (A) and expression microarray (B). **P <0.001 by Wilcoxon rank sum test. (C) Boxplot showing the difference in promoter enrichment for H3K4me3 between Dnmt1+/+ and Dnmt1-/- MEFs as measured by ChIP-chip. **P <0.001 by Wilcoxon rank sum test. (D) Venn diagram showing overlap between H3K27me3 down genes (red circle) and genes that show >2-fold increased expression in Dnmt1-/- relative to Dnmt1+/+ MEFs by mRNA-seq (yellow circle). The number of genes in each section of the diagram is shown. **P <0.001 as estimated by hyper-geometric testing for the enrichment of the overlap genes.
Figure 6
Figure 6
Demethylation with a DNA methyltransferase inhibitor results in redistribution of H3K27me3. (A) Global quantification of the 5mC base by HPLC. Values are 5 mC as a percentage of total C in Dnmt1+/+ MEFs treated with vector control or 5-aza-dC. Error bars represent standard error of the mean (SEM). **P <0.001 by t-test. (B) ChIP-qPCR for H3K27me3 in Dnmt1+/+ MEFs treated with vector control or 5-aza-dC using primers for the promoters of the indicated genes. Enrichment for each immunoprecipitation (IP) is expressed as percentage of DNA in input. Non-specific IgG IP and the Actb promoter are shown as negative controls and the Chdh promoter is shown as a positive control. Error bars indicate ±SEM of two experiments. (C, D) Boxplots showing the relative expression (log2) of the indicated gene set, and all genes, between vector control and treatment with 5-aza-dC in Dnmt1+/+ MEFs. The gene sets compared are those that are both H3K27me3 down and >1.5 fold upregulated at mRNA level in Dnmt1-/- MEFs (C), and H3K27me3 up in Dnmt1-/- MEFs (D). **P <0.005 by Wilcoxon rank sum test relative to all genes. (E) qRT-PCR quantifying expression of the indicated genes in Dnmt1+/+ MEFs treated with vector control or 5-aza-dC. Expression is normalized to Actb and expressed relative to vector control. Error bars represent ±SEM of three replicates. 5-aza-dC, 5-aza-2-deoxycytidine; DMSO, dimethyl sulfoxide; IgG, immunoglobulin G.
Figure 7
Figure 7
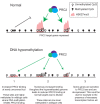
A model for de-repression of Polycomb target genes upon loss of DNA methylation. In normal cells, PRC2 is targeted to chromatin in a process that involves unmethylated stretches of DNA, such as CpG islands (PRC2 targeting is indicated by green arrows). DNA methylation has a negative effect on PRC2 binding to chromatin and so constrains PRC2 targeting. When global DNA methylation levels are reduced, PRC2 binding and H3K27me3 increase at numerous additional genomic loci leading to a dilution of available PRC2 from its normal targets. Note that only loci that are somehow permissive to PRC2 binding show increased H3K27me3 in hypomethylated cells. Reduced PRC2 binding to its normal target promoters results in loss of transcriptional repression. PRC2, Polycomb Repressive Complex 2.

Similar articles

Cited by

References

    1. Bird A. The dinucleotide CG as a genomic signalling module. J Mol Biol. 2011;14:47–53. doi: 10.1016/j.jmb.2011.01.056. - DOI - PubMed
    1. Margueron R, Reinberg D. The Polycomb complex PRC2 and its mark in life. Nature. 2011;14:343–349. doi: 10.1038/nature09784. - DOI - PMC - PubMed
    1. Lister R, Pelizzola M, Dowen RH, Hawkins RD, Hon G, Tonti-Filippini J, Nery JR, Lee L, Ye Z, Ngo QM, Edsall L, Antosiewicz-Bourget J, Stewart R, Ruotti V, Millar AH, Thomson JA, Ren B, Ecker JR. Human DNA methylomes at base resolution show widespread epigenomic differences. Nature. 2009;14:315–322. doi: 10.1038/nature08514. - DOI - PMC - PubMed
    1. Laurent L, Wong E, Li G, Huynh T, Tsirigos A, Ong CT, Low HM, Kin Sung KW, Rigoutsos I, Loring J, Wei CL. Dynamic changes in the human methylome during differentiation. Genome Res. 2010;14:320–331. doi: 10.1101/gr.101907.109. - DOI - PMC - PubMed
    1. Meissner A, Mikkelsen TS, Gu H, Wernig M, Hanna J, Sivachenko A, Zhang X, Bernstein BE, Nusbaum C, Jaffe DB, Gnirke A, Jaenisch R, Lander ES. Genome-scale DNA methylation maps of pluripotent and differentiated cells. Nature. 2008;14:766–770. - PMC - PubMed

Publication types

Associated data