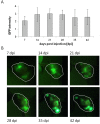
Growth inhibition of different human colorectal cancer xenografts after a single intravenous injection of oncolytic vaccinia virus GLV-1h68
- PMID: 23531320
- PMCID: PMC3621142
- DOI: 10.1186/1479-5876-11-79
Growth inhibition of different human colorectal cancer xenografts after a single intravenous injection of oncolytic vaccinia virus GLV-1h68
Abstract
Background: Despite availability of efficient treatment regimens for early stage colorectal cancer, treatment regimens for late stage colorectal cancer are generally not effective and thus need improvement. Oncolytic virotherapy using replication-competent vaccinia virus (VACV) strains is a promising new strategy for therapy of a variety of human cancers.
Methods: Oncolytic efficacy of replication-competent vaccinia virus GLV-1h68 was analyzed in both, cell cultures and subcutaneous xenograft tumor models.
Results: In this study we demonstrated for the first time that the replication-competent recombinant VACV GLV-1h68 efficiently infected, replicated in, and subsequently lysed various human colorectal cancer lines (Colo 205, HCT-15, HCT-116, HT-29, and SW-620) derived from patients at all four stages of disease. Additionally, in tumor xenograft models in athymic nude mice, a single injection of intravenously administered GLV-1h68 significantly inhibited tumor growth of two different human colorectal cell line tumors (Duke's type A-stage HCT-116 and Duke's type C-stage SW-620), significantly improving survival compared to untreated mice. Expression of the viral marker gene ruc-gfp allowed for real-time analysis of the virus infection in cell cultures and in mice. GLV-1h68 treatment was well-tolerated in all animals and viral replication was confined to the tumor. GLV-1h68 treatment elicited a significant up-regulation of murine immune-related antigens like IFN-γ, IP-10, MCP-1, MCP-3, MCP-5, RANTES and TNF-γ and a greater infiltration of macrophages and NK cells in tumors as compared to untreated controls.
Conclusion: The anti-tumor activity observed against colorectal cancer cells in these studies was a result of direct viral oncolysis by GLV-1h68 and inflammation-mediated innate immune responses. The therapeutic effects occurred in tumors regardless of the stage of disease from which the cells were derived. Thus, the recombinant vaccinia virus GLV-1h68 has the potential to treat colorectal cancers independently of the stage of progression.
Figures


Similar articles
-
Efficient colonization and therapy of human hepatocellular carcinoma (HCC) using the oncolytic vaccinia virus strain GLV-1h68.PLoS One. 2011;6(7):e22069. doi: 10.1371/journal.pone.0022069. Epub 2011 Jul 11. PLoS One. 2011. PMID: 21779374 Free PMC article.
-
Recombinant vaccinia virus GLV-1h68 is a promising oncolytic vector in the treatment of cholangiocarcinoma.Cancer Gene Ther. 2015 Dec;22(12):591-6. doi: 10.1038/cgt.2015.60. Epub 2015 Nov 20. Cancer Gene Ther. 2015. PMID: 26584530
-
Regression of human pancreatic tumor xenografts in mice after a single systemic injection of recombinant vaccinia virus GLV-1h68.Mol Cancer Ther. 2009 Jan;8(1):141-51. doi: 10.1158/1535-7163.MCT-08-0533. Mol Cancer Ther. 2009. PMID: 19139123 Free PMC article.
-
The employment of vaccinia virus for colorectal cancer treatment: A review of preclinical and clinical studies.Hum Vaccin Immunother. 2022 Nov 30;18(6):2143698. doi: 10.1080/21645515.2022.2143698. Epub 2022 Nov 11. Hum Vaccin Immunother. 2022. PMID: 36369829 Free PMC article. Review.
-
Progress in gene therapy using oncolytic vaccinia virus as vectors.J Cancer Res Clin Oncol. 2018 Dec;144(12):2433-2440. doi: 10.1007/s00432-018-2762-x. Epub 2018 Oct 6. J Cancer Res Clin Oncol. 2018. PMID: 30293118 Review.
Cited by
-
Tumor-Associated Macrophage Status in Cancer Treatment.Cancers (Basel). 2020 Jul 21;12(7):1987. doi: 10.3390/cancers12071987. Cancers (Basel). 2020. PMID: 32708142 Free PMC article. Review.
-
Remodeling the tumor microenvironment by oncolytic viruses: beyond oncolysis of tumor cells for cancer treatment.J Immunother Cancer. 2022 May;10(5):e004167. doi: 10.1136/jitc-2021-004167. J Immunother Cancer. 2022. PMID: 35640930 Free PMC article. Review.
-
The Ectopic Expression of SurvivinT34A and FilC Can Enhance the Oncolytic Effects of Vaccinia Virus in Murine Gastric Cancer.Onco Targets Ther. 2020 Feb 3;13:1011-1025. doi: 10.2147/OTT.S230902. eCollection 2020. Onco Targets Ther. 2020. PMID: 32099404 Free PMC article.
-
Anti-tumor activity of a recombinant measles virus against canine lung cancer cells.Sci Rep. 2023 Oct 24;13(1):18168. doi: 10.1038/s41598-023-42305-9. Sci Rep. 2023. PMID: 37875555 Free PMC article.
-
Mesenchymal stem cell-released oncolytic virus: an innovative strategy for cancer treatment.Cell Commun Signal. 2023 Feb 24;21(1):43. doi: 10.1186/s12964-022-01012-0. Cell Commun Signal. 2023. PMID: 36829187 Free PMC article. Review.
References
-
- Skibber J, Minksy B, Hoff P. In: Cancer: Principles and Practice of Oncology. DeVita SH V, Rosenberg S, editor. Philadelphia: Lippincott Williams and Wilkins; 2001. Cancer of the colon; pp. 1216–1271.
Publication types
MeSH terms
LinkOut - more resources
Full Text Sources
Other Literature Sources
Medical
Miscellaneous

