

Real-time motion analysis reveals cell directionality as an indicator of breast cancer progression
- PMID: 23527039
- PMCID: PMC3602596
- DOI: 10.1371/journal.pone.0058859
Real-time motion analysis reveals cell directionality as an indicator of breast cancer progression
Abstract
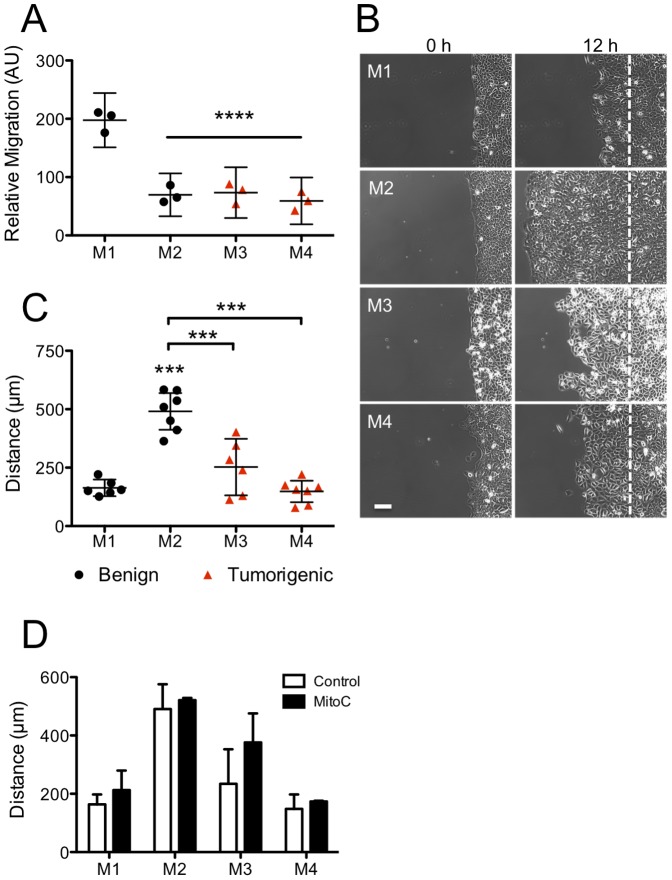
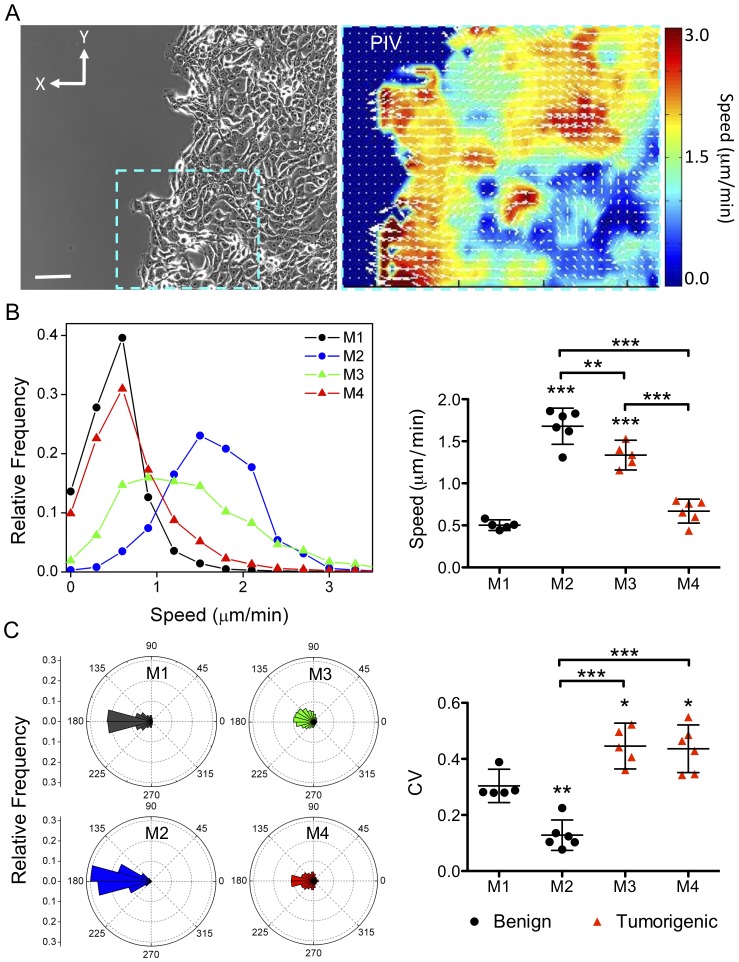
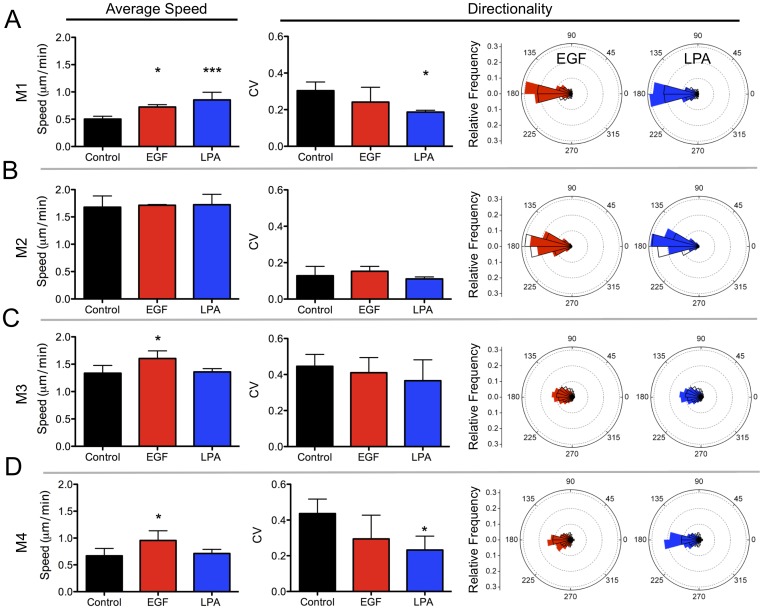
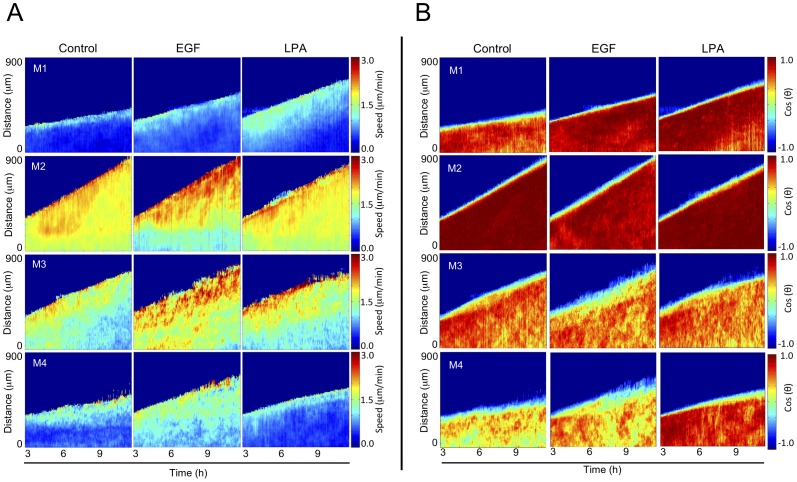
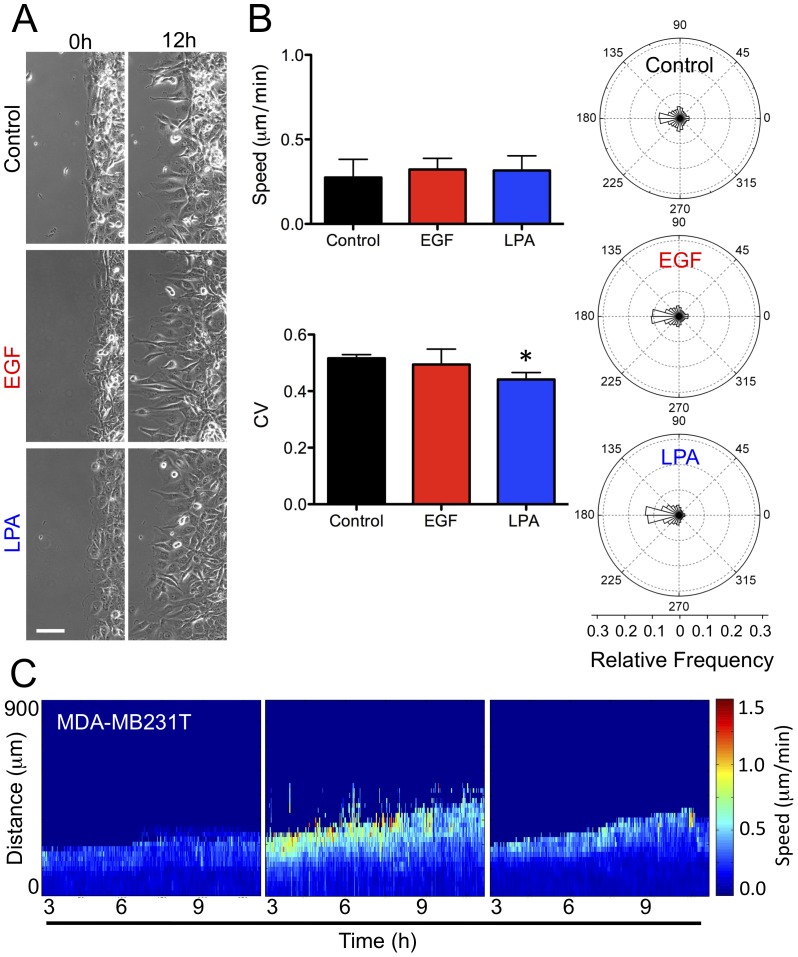
Cancer cells alter their migratory properties during tumor progression to invade surrounding tissues and metastasize to distant sites. However, it remains unclear how migratory behaviors differ between tumor cells of different malignancy and whether these migratory behaviors can be utilized to assess the malignant potential of tumor cells. Here, we analyzed the migratory behaviors of cell lines representing different stages of breast cancer progression using conventional migration assays or time-lapse imaging and particle image velocimetry (PIV) to capture migration dynamics. We find that the number of migrating cells in transwell assays, and the distance and speed of migration in unconstrained 2D assays, show no correlation with malignant potential. However, the directionality of cell motion during 2D migration nicely distinguishes benign and tumorigenic cell lines, with tumorigenic cell lines harboring less directed, more random motion. Furthermore, the migratory behaviors of epithelial sheets observed under basal conditions and in response to stimulation with epidermal growth factor (EGF) or lysophosphatitic acid (LPA) are distinct for each cell line with regard to cell speed, directionality, and spatiotemporal motion patterns. Surprisingly, treatment with LPA promotes a more cohesive, directional sheet movement in lung colony forming MCF10CA1a cells compared to basal conditions or EGF stimulation, implying that the LPA signaling pathway may alter the invasive potential of MCF10CA1a cells. Together, our findings identify cell directionality as a promising indicator for assessing the tumorigenic potential of breast cancer cell lines and show that LPA induces more cohesive motility in a subset of metastatic breast cancer cells.
Conflict of interest statement
Figures
Similar articles
-
Lysophosphatidic acid regulates the motility of MCF10CA1a breast cancer cell sheets via two opposing signaling pathways.Cell Signal. 2018 May;45:1-11. doi: 10.1016/j.cellsig.2018.01.005. Epub 2018 Jan 11. Cell Signal. 2018. PMID: 29337044 Free PMC article.
-
Using the Dot Assay to Analyze Migration of Cell Sheets.J Vis Exp. 2017 Dec 5;(130):56451. doi: 10.3791/56451. J Vis Exp. 2017. PMID: 29286487 Free PMC article.
-
LPA1 receptors mediate stimulation, whereas LPA2 receptors mediate inhibition, of migration of pancreatic cancer cells in response to lysophosphatidic acid and malignant ascites.Carcinogenesis. 2009 Mar;30(3):457-65. doi: 10.1093/carcin/bgp011. Epub 2009 Jan 7. Carcinogenesis. 2009. PMID: 19129242
-
The matrix environmental and cell mechanical properties regulate cell migration and contribute to the invasive phenotype of cancer cells.Rep Prog Phys. 2019 Jun;82(6):064602. doi: 10.1088/1361-6633/ab1628. Epub 2019 Apr 4. Rep Prog Phys. 2019. PMID: 30947151 Review.
-
Roles of LPA receptor signaling in breast cancer.Expert Rev Mol Diagn. 2016 Oct;16(10):1103-1111. doi: 10.1080/14737159.2016.1238763. Epub 2016 Sep 28. Expert Rev Mol Diagn. 2016. PMID: 27644846 Review.
Cited by
-
Clustering and jamming in epithelial-mesenchymal co-cultures.Soft Matter. 2016 Oct 12;12(40):8327-8337. doi: 10.1039/c6sm01287f. Soft Matter. 2016. PMID: 27722738 Free PMC article.
-
Unjamming and collective migration in MCF10A breast cancer cell lines.Biochem Biophys Res Commun. 2020 Jan 15;521(3):706-715. doi: 10.1016/j.bbrc.2019.10.188. Epub 2019 Nov 4. Biochem Biophys Res Commun. 2020. PMID: 31699371 Free PMC article.
-
Label-free cell tracking enables collective motion phenotyping in epithelial monolayers.iScience. 2022 Jun 27;25(7):104678. doi: 10.1016/j.isci.2022.104678. eCollection 2022 Jul 15. iScience. 2022. PMID: 35856018 Free PMC article.
-
Keratin 6 regulates collective keratinocyte migration by altering cell-cell and cell-matrix adhesion.J Cell Biol. 2018 Dec 3;217(12):4314-4330. doi: 10.1083/jcb.201712130. Epub 2018 Nov 2. J Cell Biol. 2018. PMID: 30389720 Free PMC article.
-
Amygdalin influences bladder cancer cell adhesion and invasion in vitro.PLoS One. 2014 Oct 15;9(10):e110244. doi: 10.1371/journal.pone.0110244. eCollection 2014. PLoS One. 2014. PMID: 25333694 Free PMC article.
References
-
- Friedl P, Gilmour D (2009) Collective cell migration in morphogenesis, regeneration and cancer. Nat Rev Mol Cell Biol 10: 445–457. - PubMed
-
- Hanahan D, Weinberg RA (2011) Hallmarks of cancer: the next generation. Cell 144: 646–674. - PubMed
-
- Howlader N NA, Krapcho M, Neyman N, Aminou R, Altekruse SF, et al. (2009) SEER Cancer Statistics Review, 1975–2009 (Vintage 2009 Populations). Bethesda, MD: National Cancer Institute.
-
- Gupta GP, Massague J (2006) Cancer metastasis: building a framework. Cell 127: 679–695. - PubMed
Publication types
MeSH terms
Substances
Grants and funding
LinkOut - more resources
Full Text Sources
Other Literature Sources
Medical
Miscellaneous
