

Analysis of factors influencing the development of xerostomia during intensity-modulated radiotherapy
- PMID: 23523462
- PMCID: PMC3665637
- DOI: 10.1016/j.oooo.2013.01.006
Analysis of factors influencing the development of xerostomia during intensity-modulated radiotherapy
Abstract
Objectives: Factors influencing xerostomia during intensity-modulated radiation therapy (IMRT) were assessed.
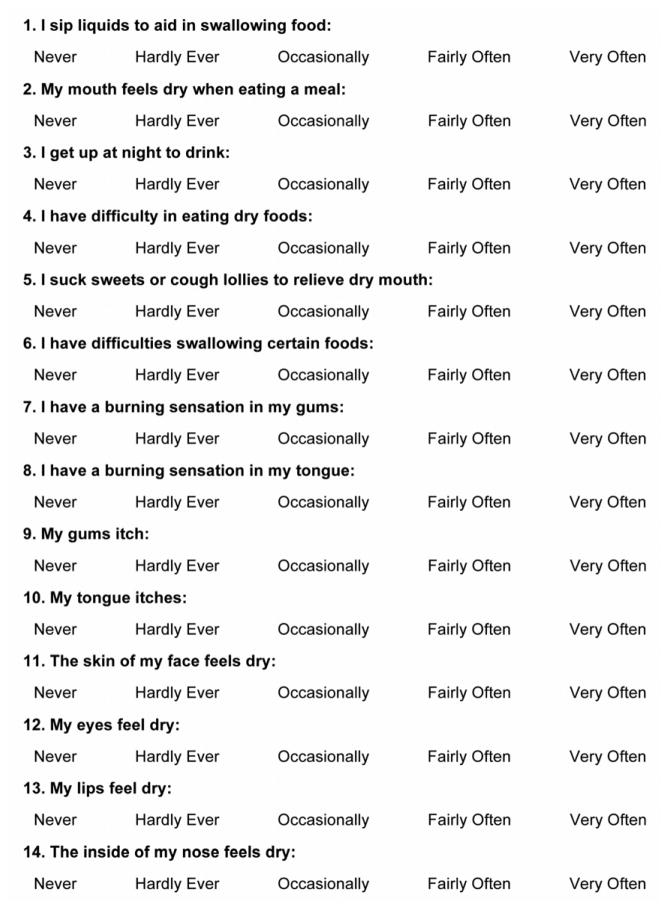
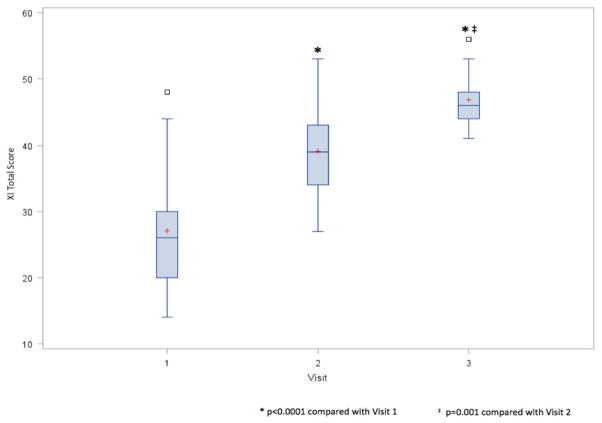
Methods: A 6-week study of 32 head and neck cancer (HNC) patients was performed. Subjects completed the Xerostomia Inventory (XI) and provided stimulated saliva (SS) at baseline, week 2 and at end of IMRT. Influence of SS flow rate (SSFR), calcium and mucin 5b (MUC5b) concentrations and radiation dose on xerostomia was determined.
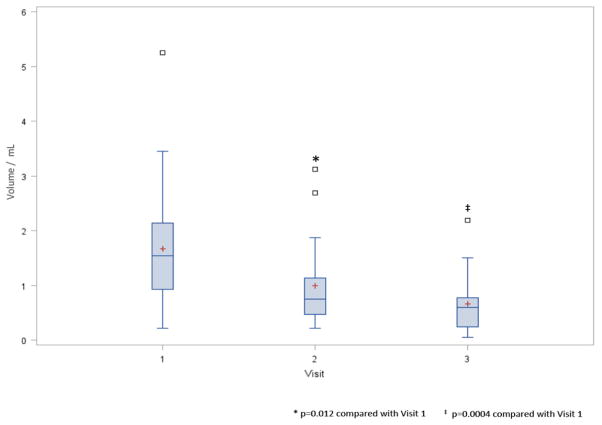
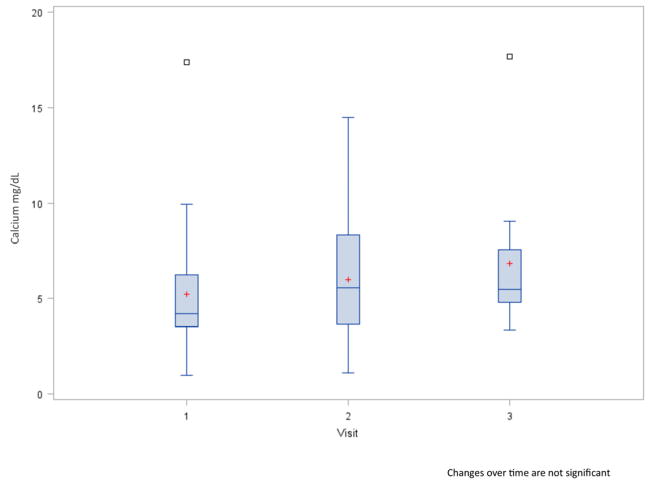
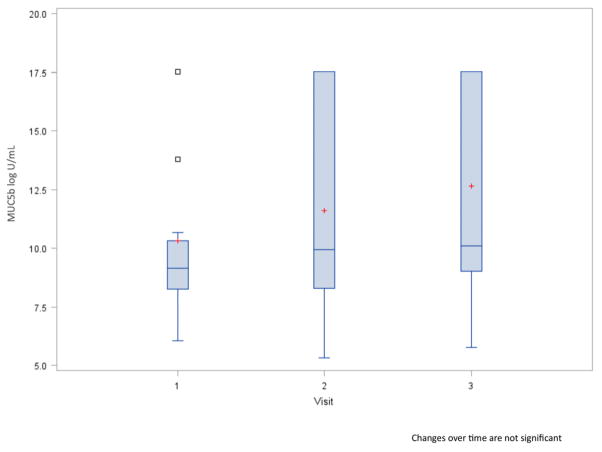
Results: HNC subjects experienced mean SSFR decline of 36% by visit 2 (N = 27; P = .012) and 57% by visit 3 (N = 20; P = .0004). Concentrations of calcium and MUC5b increased, but not significantly during IMRT (P > .05). Xerostomia correlated most with decreasing salivary flow rate as determined by Spearman correlations (P < .04) and linear mixed models (P < .0001).
Conclusions: Although IMRT is sparing to the parotid glands, it has an early effect on SSFR and the constituents in saliva in a manner that is associated with the perception of xerostomia.
Copyright © 2013 Elsevier Inc. All rights reserved.
Conflict of interest statement
Figures
Similar articles
-
The effect of parotid gland-sparing intensity-modulated radiotherapy on salivary composition, flow rate and xerostomia measures.Oral Dis. 2017 Oct;23(7):990-1000. doi: 10.1111/odi.12686. Epub 2017 Jun 5. Oral Dis. 2017. PMID: 28434191 Free PMC article.
-
MUC5B levels in submandibular gland saliva of patients treated with radiotherapy for head-and-neck cancer: a pilot study.Radiat Oncol. 2012 Jun 15;7:91. doi: 10.1186/1748-717X-7-91. Radiat Oncol. 2012. PMID: 22704532 Free PMC article.
-
Objective and subjective assessment of xerostomia in patients of locally advanced head-and-neck cancers treated by intensity-modulated radiotherapy.J Cancer Res Ther. 2018 Oct-Dec;14(6):1196-1201. doi: 10.4103/jcrt.JCRT_200_17. J Cancer Res Ther. 2018. PMID: 30488829
-
Intensity-modulated radiotherapy: is xerostomia still prevalent?Curr Oncol Rep. 2005 Mar;7(2):131-6. doi: 10.1007/s11912-005-0039-4. Curr Oncol Rep. 2005. PMID: 15717947 Review.
-
IMRT for head and neck cancer: reducing xerostomia and dysphagia.J Radiat Res. 2016 Aug;57 Suppl 1(Suppl 1):i69-i75. doi: 10.1093/jrr/rrw047. J Radiat Res. 2016. PMID: 27538846 Free PMC article. Review.
Cited by
-
Proteomic Profiling of Saliva and Tears in Radiated Head and Neck Cancer Patients as Compared to Primary Sjögren's Syndrome Patients.Int J Mol Sci. 2022 Mar 28;23(7):3714. doi: 10.3390/ijms23073714. Int J Mol Sci. 2022. PMID: 35409074 Free PMC article.
-
Proteins and peptides in parotid saliva of irradiated patients compared to that of healthy controls using SELDI-TOF-MS.BMC Res Notes. 2015 Nov 3;8:639. doi: 10.1186/s13104-015-1641-7. BMC Res Notes. 2015. PMID: 26530239 Free PMC article.
-
Oral and ocular late effects in head and neck cancer patients treated with radiotherapy.Sci Rep. 2021 Feb 17;11(1):4026. doi: 10.1038/s41598-021-83635-w. Sci Rep. 2021. PMID: 33597629 Free PMC article.
-
The effect of parotid gland-sparing intensity-modulated radiotherapy on salivary composition, flow rate and xerostomia measures.Oral Dis. 2017 Oct;23(7):990-1000. doi: 10.1111/odi.12686. Epub 2017 Jun 5. Oral Dis. 2017. PMID: 28434191 Free PMC article.
-
Saliva Metabolomics in Dry Mouth Patients with Head and Neck Cancer or Sjögren's Syndrome.Cells. 2022 Jan 19;11(3):323. doi: 10.3390/cells11030323. Cells. 2022. PMID: 35159133 Free PMC article.
References
-
- Surveillance Epidemiology and End Results NCI Cancer Stat Fact Sheets. [Accessed July 20 2012].
-
- Navazesh M, Christensen C, Brightman V. Clinical criteria for the diagnosis of salivary gland hypofunction. J Dent Res. 1992;71:1363–69. - PubMed
-
- Valdez IH, Atkinson JC, Ship JA, Fox PC. Major salivary gland function in patients with radiation-induced xerostomia: flow rates and sialochemistry. Int J Radiat Oncol Biol Phys. 1993;25(1):41–7. - PubMed
-
- Shannon IL, Starcke EN, Wescott WB. Effect of radiotherapy on whole saliva flow. J Dent Res. 1977;56(6):693. - PubMed
-
- Mossman KL, Shatzman AR, Chencharick JD. Effects of radiotherapy on human parotid saliva. Radiat Res. 1981;88(2):403–12. - PubMed
Publication types
MeSH terms
Substances
Grants and funding
LinkOut - more resources
Full Text Sources
Other Literature Sources
Medical
