. 2013 Mar 18;23(3):376-89.
doi: 10.1016/j.ccr.2013.02.014.

The histone demethylase PHF8 governs retinoic acid response in acute promyelocytic leukemia

Affiliations

The histone demethylase PHF8 governs retinoic acid response in acute promyelocytic leukemia

Maria Francisca Arteaga et al. Cancer Cell. .

Abstract

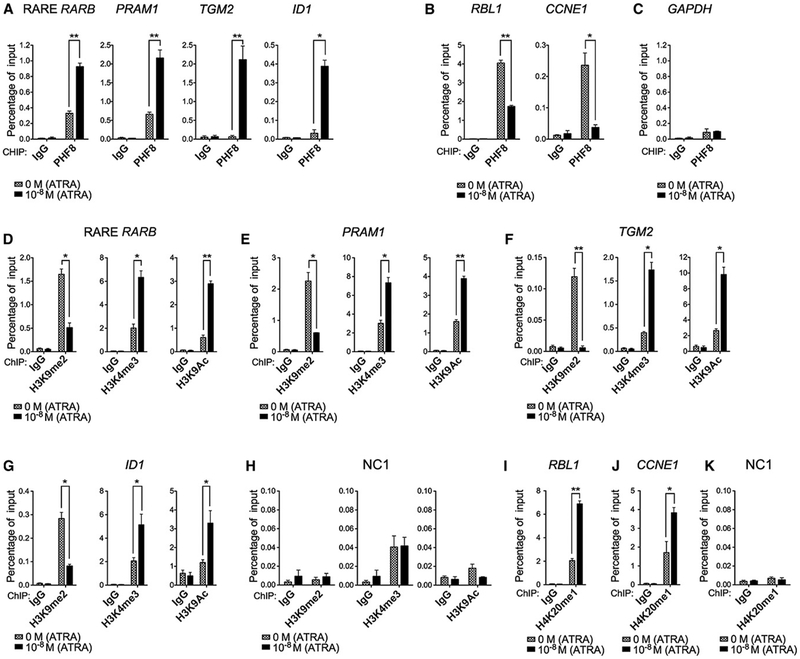
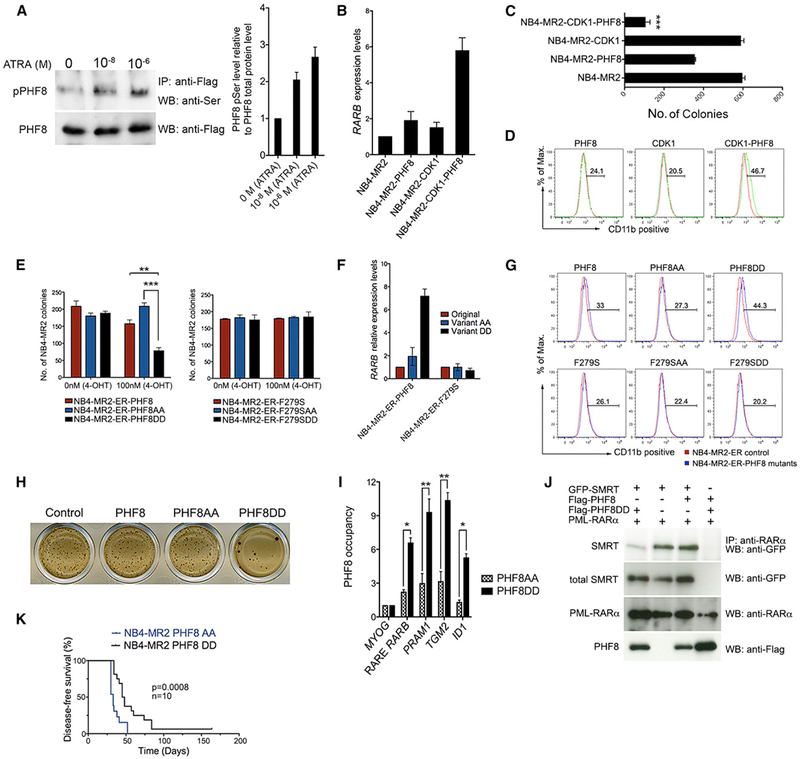
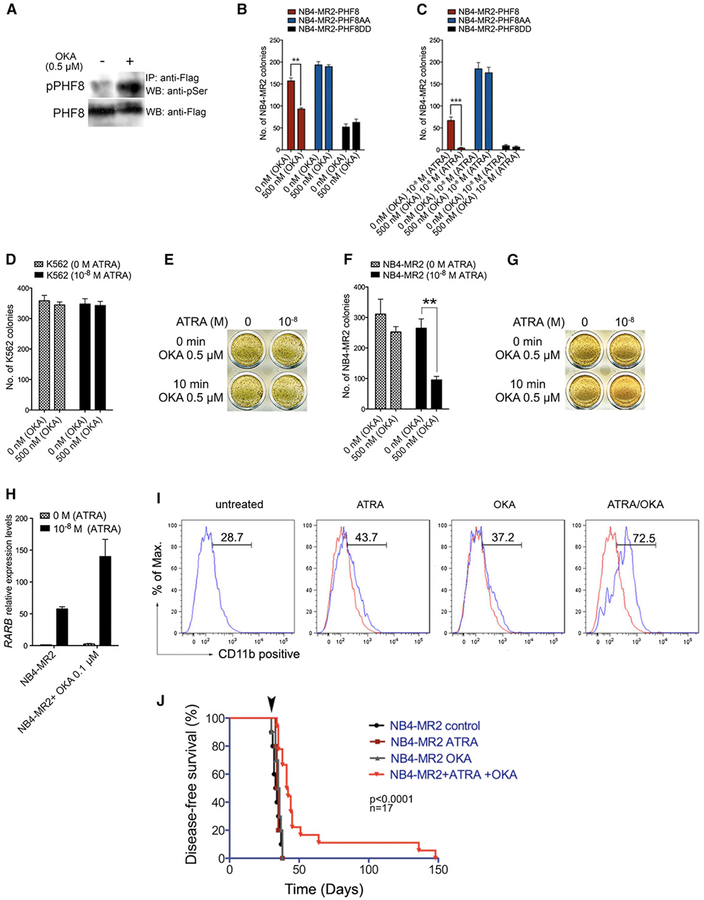
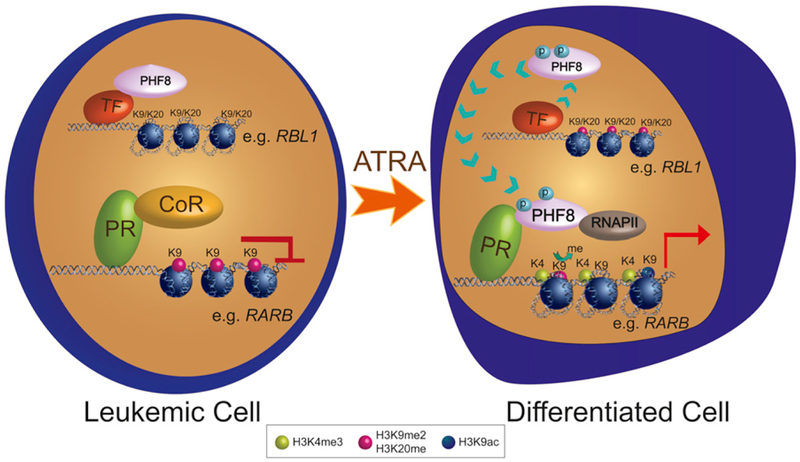
While all-trans retinoic acid (ATRA) treatment in acute promyelocytic leukemia (APL) has been the paradigm of targeted therapy for oncogenic transcription factors, the underlying mechanisms remain largely unknown, and a significant number of patients still relapse and become ATRA resistant. We identified the histone demethylase PHF8 as a coactivator that is specifically recruited by RARα fusions to activate expression of their downstream targets upon ATRA treatment. Forced expression of PHF8 resensitizes ATRA-resistant APL cells, whereas its downregulation confers resistance. ATRA sensitivity depends on the enzymatic activity and phosphorylation status of PHF8, which can be pharmacologically manipulated to resurrect ATRA sensitivity to resistant cells. These findings provide important molecular insights into ATRA response and a promising avenue for overcoming ATRA resistance.


Figures

Figure 1.
Figure 1.. Specific Interaction of PHF8 with PML-RARα Results in Alternation of Histone Marks of Transcriptional Targets in Response to ATRA Treatment
(A–F) Representative coimmunoprecipitation (coIP) analysis in 293T cells coexpressing PML-RARα and Flag-tagged Jumonji family members cultured in the presence or absence of ATRA (A). Deleted or point mutants of PML-RARα were coexpressed with PHF8 (B), or deleted or point mutants of PHF8 were coexpressed with His-PML-RARα (C); and all samples were processed in presence of ATRA. Black arrowheads indicate mutants that cannot interact. PML-RARα or/and wild-type RARα were expressed with Flag-tagged PHF8 using the indicated amounts of expression vectors, and cells were treated with ATRA as indicated; samples were processed under mild washing conditions (D) or stringent washing conditions (E and F). Asterisk indicates unspecific band. (G) Immunoblotting of purified histone extracts from NB4 and NB4-PHF8 cells. (H) Histone demethylase activity of YFP-tagged PHF8 protein in 293T cells was assessed by immunostaining using confocal microscopy. White arrowheads indicate cells transfected with YFP-PHF8. Scale bar, 10 μm. Anti-H3K9me2 and anti-H3K9me3 antibodies were used. (I and J) ChIP analysis of the binding of the endogenous PHF8 (I) and histone H3 modifications (J) on typical RARE RARB promoter region in human NB4 cells after 24 hr with or without 10−8 M ATRA. Data representative of at least three independent experiments are shown (±SD, *p < 0.05, **p < 0.01). See also Figure S1.
Figure 2.
Figure 2.. PHF8 Governs ATRA Sensitivity of APL Cells
(A–D) Typical p-iodonitrotetrazolium-violet (INT)-stained colony pictures and bar charts representing normalized colony number of human NB4 and K562 cells (A and B) or murine primary bone marrow cells transformed by the indicated RARα fusion constructs (C and D) treated with and without indicated concentration of ATRA. Black arrowheads indicate the lowest optimal ATRA concentration employed in most of the subsequent studies. Representative data of three experiments are shown (±SEM, **p < 0.01). (E) Quantitative RT-PCR (qRT-PCR) analysis for RARB expression in the indicated cells. (F–J) qRT-PCR (F and I) and western blot analysis (G and J) for PHF8 expression in cell transduced with specific human (F and G) or mouse (I and J) PHF8 shRNA. Error bars indicate SD of at least three independent experiments. (H) Human NB4 cells or (K) murine primary bone marrow cells transformed by PLZF-RARα were transduced with either shRNAs for specific PHF8 knockdown (KD) or scramble control before they were plated into methylcellulose medium in the absence or presence of ATRA for colony formation assay. Data representative of three experiments are shown (±SEM, *p < 0.05, **p < 0.01, ***p < 0.001). See also Figure S2.
Figure 3.
Figure 3.. PHF8 Sensitizes ATRA-Resistant APL Cells to Physiological Concentrations of ATRA
(A–H) Human APL cells transduced with vector control or PHF8 wild-type or its catalytically inactive mutant F279S were treated with and without ATRA at the indicated concentrations. Typical INT-stained colony pictures of NB4-MR2 (A) and NB4-LR2 (F) cell lines. The bar charts represent NB4-MR2 normalized numbers of colonies (B). Error bars are representative of four independent experiments. (±SEM, ***p < 0.001). qRT-PCR analysis for human RARB expression in NB4-MR2 (C) or NB4-LR2 (G) cell lines. Error bars indicate SD of three independent experiments. Disease-free survival of NSG mice injected with NB4-MR2, NB4-MR2-PHF8 cells (D), NB4-MR2-F279S cells (E), or NB4-LR2, NB4-LR2-PHF8 cells (H), with and without ATRA treatment. (I and J) M4 cells from PML-RARα LBD transgenic mouse model transduced with vector control (control M4) or PHF8 wild-type (PHF8 M4). Disease-free survival of FVB mice injected with control M4 or PHF8 M4 cells with and without ATRA treatment. Black arrowheads indicate the end of ATRA treatment (I). FACS analysis of bone marrow cells stained with Gr-1, Mac-1, and c-Kit markers for differentiation status of murine myeloid cells (J). See also Figure S3.
Figure 4.
Figure 4.. Changes of PHF8 Promoter Occupancy and Associated Histone Modifications after ATRA Induction
ChIP analysis of PHF8 (A–C) or various histone marks including H3K9me2, H3K4me3, H3K9Ac, H4K20me1 (D–K) on both RARα-fusion-targeted promoters (e.g., RARB, PRAM1, TGM2, and ID1) and naive PHF8-targeted promoters (e.g., RBL1, CCNE1) before and after 24 hr of ATRA treatment at 0 M or 10−8 M in NB4-MR2-PHF8 cells. ChIP signals are presented as percentage of input. Error bars indicate SD of three independent experiments (±SD, *p < 0.05, **p < 0.01). GAPDH was used as negative control for PHF8 occupancy, and NC1 was used as negative control for histone marks. See also Figure S4.
Figure 5.
Figure 5.. PHF8-Mediated ATRA Response Is Regulated by Serine Phosphorylation
(A) PHF8 was immunoprecipitated from total cell lysate of NB4-MR2-PHF8 cells treated with the indicated concentrations of ATRA and immunoblotted for phospho-Ser (upper panel); the membrane was stripped and then immunoblotted for total PHF8 protein (lower panel). The bar chart at the right represents quantification of serine-phosphorylated PHF8 relative to the total PHF8 protein. Error bars represent SD of three independent experiments. (B–D) NB4-MR2 cells were transduced with empty vector control, wild-type PHF8, wild-type CDK1, or PHF8 and CDK1 together. The RARB mRNA level (B, measured by qRT-PCR, error bars indicate SD of three independent experiments), the number of colony formed (C, error bars represent SEM of three independent experiments, ***p < 0.001), and expression of the differentiation marker for myeloid cells CD11b (D, FACS analysis) of these cells were determined. (E) The number of colonies of NB4-MR2 cells transduced with ER-fused enzymatic active (left) or dead (right) PHF8, PHF8AA, or PHF8DD in the absence or presence of 100 nM 4-OHT. Error bars represent three independent experiments (±SEM, **p < 0.01, ***p < 0.001). (F) RARB mRNA level in cells transduced with indicated PHF8 constructs after induction with 100 nM 4-OHT shown in (E). Error bars indicate SD of three independent experiments. (G) FACS analysis for CD11b expression of NB4-MR2-ER cells expressing PHF8 or different PHF8 mutants. (H) Typical INT-stained colony pictures of NB4-MR2 cells transduced with empty vector control, PHF8, PHF8AA, or PHF8DD. (I) ChIP analysis comparing the PHF8 occupancy at the indicated promoter regions of NB4-MR2 cells transduced with PHF8AA and PHF8DD variants. ChIP signals are presented as fold enrichment over MYOG (±SD, *p < 0.05, **p < 0.01). (J) Representative coimmunoprecipitation (coIP) analysis in 293T cells. PML-RARα was coexpressed in the presence of GFP-SMRT, Flag-PHF8, or Flag-PHF8DD. (K) Disease-free survival curves of NSG mice injected with NB4-MR2 cells expressing PHF8AA or PHF8DD. See also Figure S5.
Figure 6.
Figure 6.. Okadaic Acid Specifically Inhibits PHF8 Dephosphorylation and Sensitizes NB4-MR2 Cells to ATRA Treatment
(A) Western blot analysis of PHF8 phosphorylation in NB4-MR2-PHF8 cells upon 10 min treatment with 0.5 μM OKA. Flag-tagged PHF8 was immunoprecipitated from the total lysate using anti-Flag antibody and blotted for phospho-Ser detection (upper panel) or for total PHF8 protein on the stripped membrane (lower panel). (B and C) The effect of OKA treatment on NB4-MR2 cells transduced with PHF8, PHF8AA, or PHF8DD. Cells were plated in methylcellulose after 10 min of OKA pretreatment at the indicated concentrations without (B) or with (C) ATRA treatment. Data are representative of three independent experiments (±SEM, **p < 0.01, ***p < 0.001). (D–G) K562 and NB4-MR2 cells were pretreated with OKA as described above and plated in methylcellulose with or without 10−8 M ATRA. The bar charts show the number of colonies after indicated treatment for K562 (D) and NB4-MR2 (F), while INT-stained represent typical results for K562 (E) and NB4-MR2 (G) colony formation assay. Data are representative of three independent experiments (±SEM, **p < 0.01). (H and I) NB4-MR2 cells were treated with OKA and ATRA as indicated and then analyzed for the expression of RARB by qRT-PCR (H, error bars indicate SD of three independent experiments) or CD11b by FACS (I). (J) Disease-free survival curves of NSG mice transplanted with NB4-MR2 cells and then treated as indicated. Arrow indicates the end point of the treatment. See also Figure S6.
Figure 7.
Figure 7.. Schematic Diagram Illustrates the Molecular Regulation of PHF8 in Mediating ATRA Response in APL
In leukemia, PML-RARα (PR) recruits corepressor complexes (CoR) to suppress expression of downstream targets. Upon ATRA treatment, PHF8 is phosphorylated and detaches from the original binding sites (naive PHF8 targets, e.g., RBL1 promoter) to bind to PR. PHF8 removes H3K9me2 marks and recruits additional histone modification enzymes and RNA polymerase II (RNAPII) to drive the expression of PR downstream targets (e.g., RARB) for differentiation.

Similar articles

Cited by

References

    1. Abidi FE, Miano MG, Murray JC, and Schwartz CE (2007). A novel mutation in the PHF8 gene is associated with X-linked mental retardation with cleft lip/cleft palate. Clin. Genet 72, 19–22. - PMC - PubMed
    1. Arrowsmith CH, Bountra C, Fish PV, Lee K, and Schapira M (2012). Epigenetic protein families: a new frontier for drug discovery. Nat. Rev. Drug Discov 11, 384–400. - PubMed
    1. Boukarabila H, Saurin AJ, Batsché E, Mossadegh N, van Lohuizen M, Otte AP, Pradel J, Muchardt C, Sieweke M, and Duprez E (2009). The PRC1 Polycomb group complex interacts with PLZF/RARA to mediate leukemic transformation. Genes Dev. 23, 1195–1206. - PMC - PubMed
    1. Cheung N, and So CW (2011). Transcriptional and epigenetic networks in haematological malignancy. FEBS Lett. 585, 2100–2111. - PubMed
    1. Côté S, Zhou D, Bianchini A, Nervi C, Gallagher RE, and Miller WH Jr. (2000). Altered ligand binding and transcriptional regulation by mutations in the PML/RARalpha ligand-binding domain arising in retinoic acid-resistant patients with acute promyelocytic leukemia. Blood 96, 3200–3208. - PubMed

Publication types

MeSH terms