. 2013 Mar 20;33(12):5195-207.
doi: 10.1523/JNEUROSCI.3862-12.2013.

Target-derived neurotrophins coordinate transcription and transport of bclw to prevent axonal degeneration

Affiliations

Target-derived neurotrophins coordinate transcription and transport of bclw to prevent axonal degeneration

Katharina E Cosker et al. J Neurosci. .

Abstract

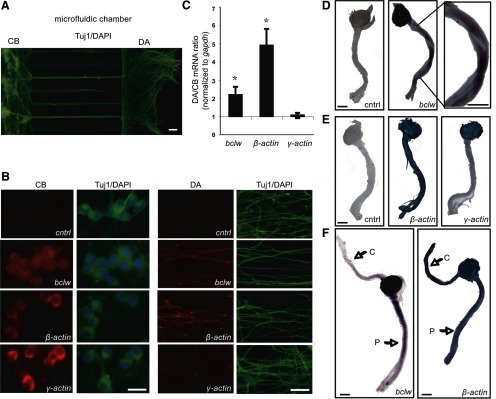
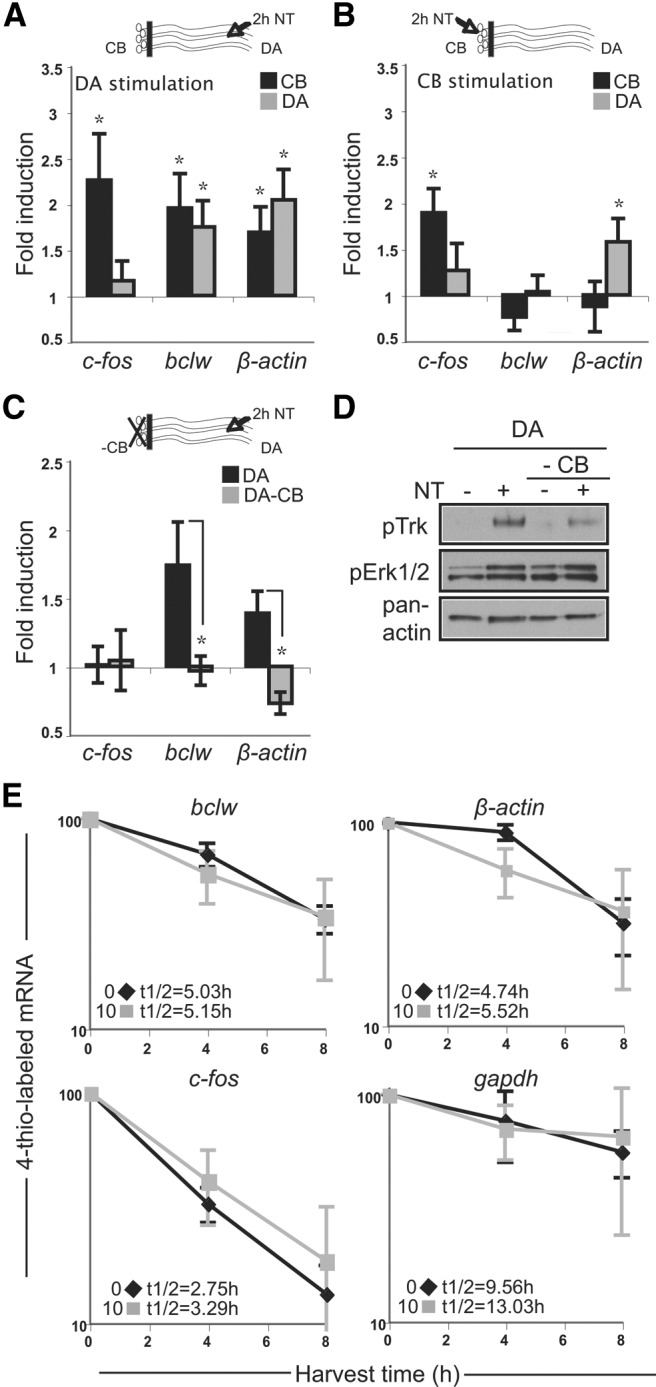
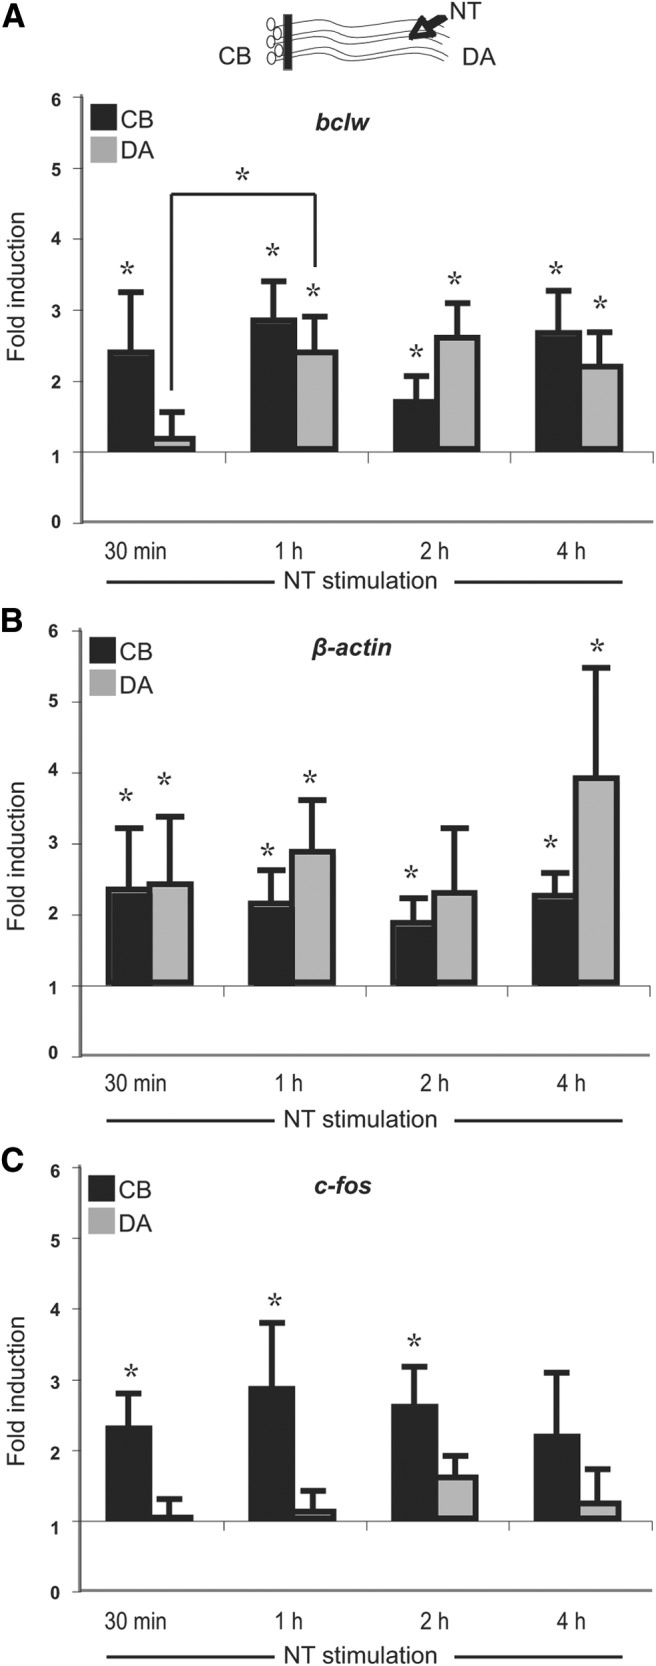
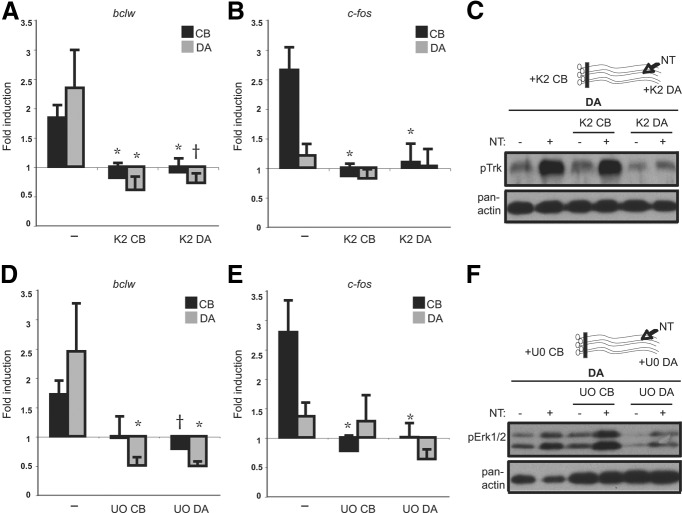
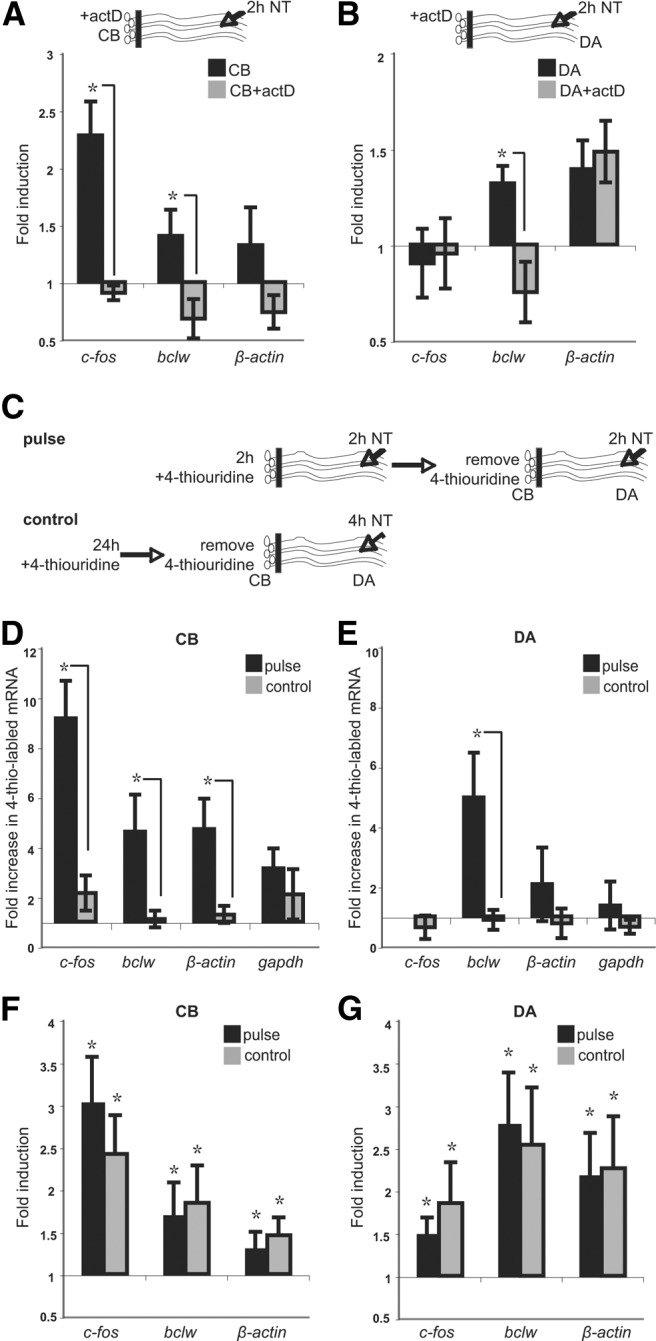
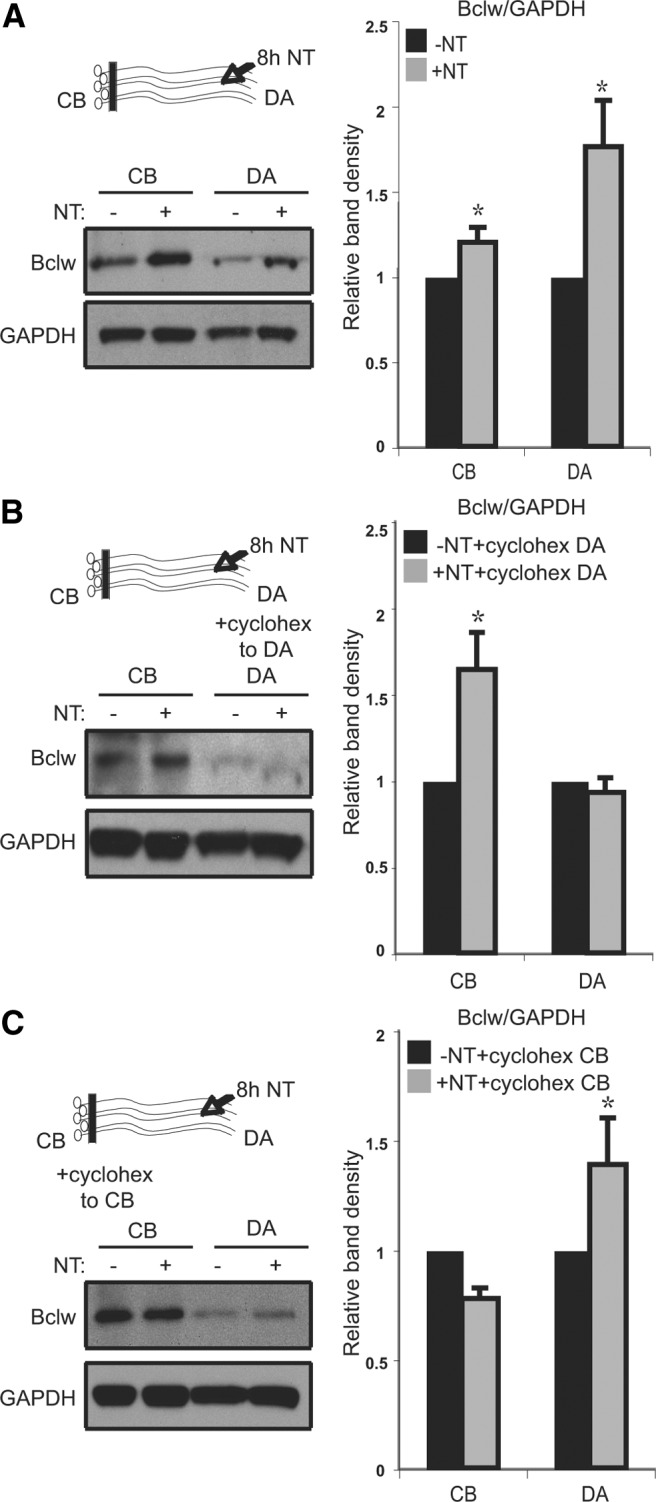
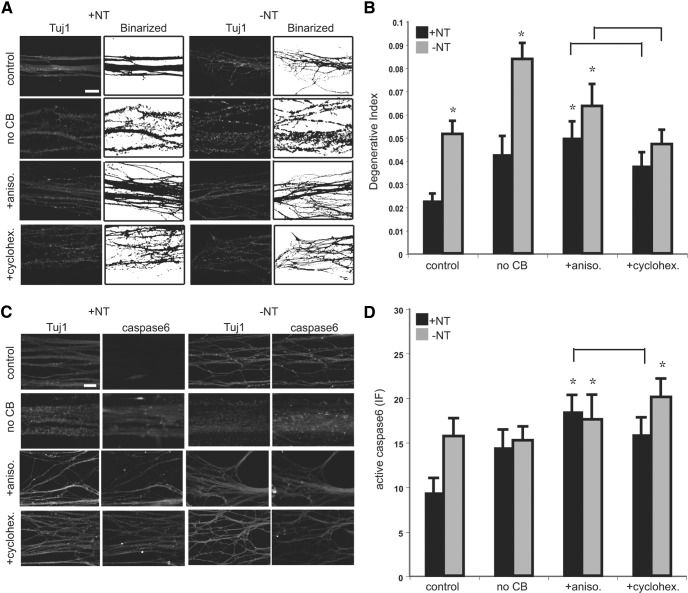
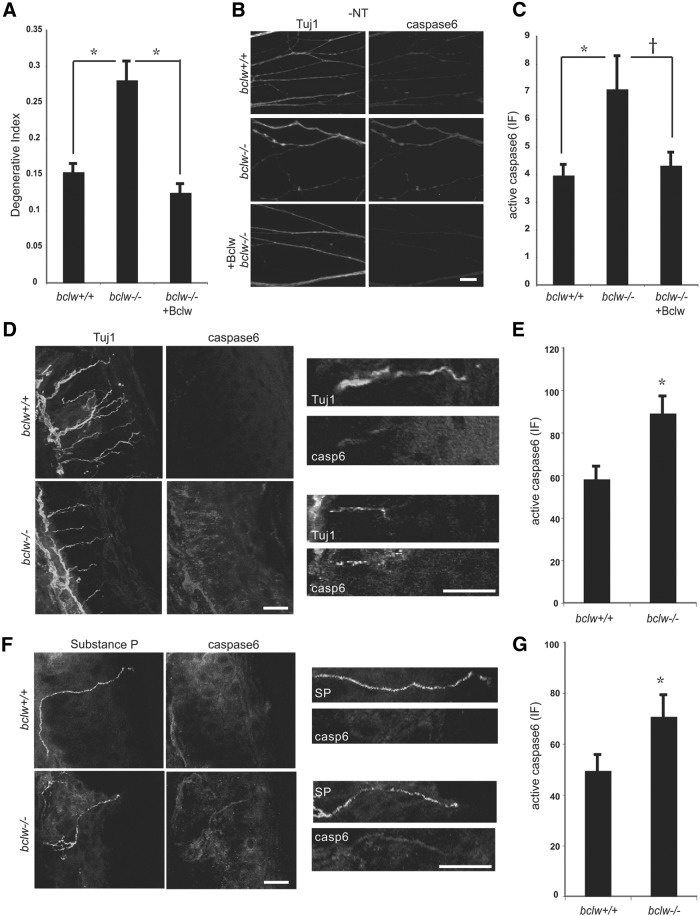
Establishment of neuronal circuitry depends on both formation and refinement of neural connections. During this process, target-derived neurotrophins regulate both transcription and translation to enable selective axon survival or elimination. However, it is not known whether retrograde signaling pathways that control transcription are coordinated with neurotrophin-regulated actions that transpire in the axon. Here we report that target-derived neurotrophins coordinate transcription of the antiapoptotic gene bclw with transport of bclw mRNA to the axon, and thereby prevent axonal degeneration in rat and mouse sensory neurons. We show that neurotrophin stimulation of nerve terminals elicits new bclw transcripts that are immediately transported to the axons and translated into protein. Bclw interacts with Bax and suppresses the caspase6 apoptotic cascade that fosters axonal degeneration. The scope of bclw regulation at the levels of transcription, transport, and translation provides a mechanism whereby sustained neurotrophin stimulation can be integrated over time, so that axonal survival is restricted to neurons connected within a stable circuit.


Figures

Figure 1.
Figure 1.
Bclw mRNA is localized in peripheral axons of sensory neurons. A, Tuj1 immunostaining (green) and DAPI staining of E15 DRG neurons grown in microfluidic chambers. Scale bar, 60 μm. B, FISH assay of bclw, β-actin, and γ-actin mRNA (red) in cell body (CB) and distal axon (DA) compartments. Counterstained images show Tuj1 antibody (green) and DAPI. Scale bars, 20 μm. C, mRNA from CB and DA of E15 DRG neurons grown in compartmented chamber cultures for bclw, β-actin, and γ-actin analyzed by qRT-PCR. Data are presented as the mean + SEM of DA mRNA/CB mRNA ratio, normalized to gapdh mRNA. Statistical analysis by z test. *p < 0.05 for a difference from 1. n = 7. D, ISH in P0 DRGs and peripheral nerves with antisense bclw and nonsense control probes. Scale bars, 500 μm. E, ISH in P0 DRGs and peripheral nerve with antisense β-actin and γ-actin and nonsense control probes. Scale bar, 500 μm. F, ISH in P0 DRGS and associated central (C) and peripheral (P) nerve with antisense bclw and β-actin probes. Scale bar, 500 μm.
Figure 2.
Figure 2.
Neurotrophins regulate bclw mRNA in cell bodies and distal axons. A, Compartmented chamber cultures were stimulated with neurotrophins (NT; 100 ng/ml NGF + BDNF) at distal axons (DA) for 2 h. Bclw and β-actin mRNA is upregulated in cell bodies (CB) and distal axons (DA). Expression is compared with neurons treated with vehicle (100 ng/ml BSA). Fold induction of c-fos mRNA is a control. All results represent the mean + SEM. *p < 0.05, difference from 1 (z test); n = 8. B, Expression of c-fos, bclw, and β-actin mRNA in CB and DA in response to 2 h NT stimulation of CB. *p < 0.05, difference from 1 (z test); n = 8. C, Severing of cell bodies during NT stimulation of DA prevents increases in bclw and β-actin mRNA in DA. D, Cell bodies were severed from axons and DA lysates were blotted with pTrk and pErk1/2. After 6 h, axons still respond to NT stimulation. Pan-actin was used as a loading control. E, Decay kinetics of bclw and β-actin mRNA and control mRNAs c-fos and gapdh in the absence (0) or presence (10) of NT. Data are presented as amount of 4-thio-labeled mRNA, normalized to no thiol control; n = 5.
Figure 3.
Figure 3.
Bclw mRNA increases in cell bodies before distal axons. Compartmented chamber cultures were stimulated with neurotrophins (NT) at distal axons (DA) for 30 min, 1 h, 2 h, and 4 h. A, After 30 min NTs induce bclw mRNA expression increases only in cell bodies (CB). All data show mean + SEM. *p < 0.05, 30 min versus 1 h (Student's t test); n = 10. At 1, 2, and 4 h, bclw mRNA increases in both CB and DA. *p < 0.05, difference from 1 (z test); n = 10. B, Expression of β-actin mRNA increases at 30 min, 1 h, 2 h, and 4 h both in CB and DA. *p < 0.05, difference from 1 (z test); n = 10. C, Expression of c-fos mRNA is induced only in CB. *p < 0.05, difference from 1 (z test); n = 10.
Figure 4.
Figure 4.
Inhibition of a Trk-Erk retrograde signal blocks induction of axonal bclw mRNA. A, Addition of Trk inhibitor K252a (K2; 200 nm) to cell bodies (CB) or distal axons (DA) blocks neurotrophin (NT) induction of bclw mRNA in CB and DA. All data show mean + SEM. B, c-fos induction is blocked by addition of K2 to CB or DA. C, Western blot of NT-induced pTrk activation in DA. D, Addition of Erk inhibitor U0126 (U0; 10 μm) to CB or DA blocks NT induction of bclw mRNA in CB and DA. E, c-fos induction is blocked by addition of U0 to CB or DA. F, Western blot of NT-induced pErk1/2 activation in DA. *p < 0.05 (one-way ANOVA with Bonferroni correction); n = 7. †p < 0.1 (one-way ANOVA with Bonferroni correction); n = 7.
Figure 5.
Figure 5.
Newly transcribed bclw mRNA is immediately targeted to distal axons. A, Addition of actD to cell bodies (CB) inhibits transcription of c-fos, bclw, and β-actin mRNA in CB in response to distal axon (DA) neurotrophin (NT) stimulation. All data show mean + SEM. *p < 0.05 (Student's t test); n = 6. B, Addition of actD to CB blocks bclw mRNA increase in distal axons (DA). *p < 0.05 (Student's t test); n = 6. C, To label new mRNA, 4-thiouridine was added to CB during 2 h of DA NT stimulation and removed for a further 2 h DA NT stimulation. In control experiments, 4-thiouridine was added for 24 h and removed before 4 h DA stimulation. D, Fold increase in newly transcribed c-fos, bclw, and β-actin mRNA in cell bodies. Levels of newly transcribed gapdh mRNA levels do not change. *p < 0.05 (Student's t test); n = 5. E, Fold increase in newly transcribed bclw mRNA in distal axons. *p < 0.05 (Student's t test); n = 5. F, Total mRNA levels of c-fos, bclw, and β-actin in CB are upregulated in pulse and control experiments. G, Total mRNA levels of c-fos, bclw, and β-actin in DA are upregulated in pulse and control experiments. *p < 0.05 for a difference from 1 (z test); n = 5.
Figure 6.
Figure 6.
Neurotrophins regulate local translation of Bclw in distal axons. A, Western blot analysis and quantification of Bclw in cell body (CB) and distal axon (DA) lysate after 8 h of DA neurotrophin (NT) stimulation. Results represent the mean + SEM normalized to GAPDH; n = 5. B, Western blot analysis and quantification of Bclw in CB and DA lysate after 8 h of DA NT stimulation with cycloheximide (10 mg/ml) added to DA. Results represent the mean + SEM normalized to GAPDH; n = 3. C, Western blot analysis and quantification of Bclw in CB and DA lysate after 8 h of DA NT stimulation with cycloheximide added to CB. Results represent the mean + SEM normalized to GAPDH; n = 3. *p < 0.05 (Student's t test).
Figure 7.
Figure 7.
Local translation prevents axon degeneration and caspase6 activation. A,Tuj1-labeled axons in the presence (+NT; left) and absence (−NT; right) of neurotrophins. Axons were severed from cell bodies (no CB) or treated with anisomycin or cycloheximide as indicated and deprived of NT for 10 h. Binarized images show fragmented axons defined by the Analyze Particle function in National Institutes of Health ImageJ software. Scale bar, 40 μm. B, Quantification of axonal degeneration (ratio of area of fragmented axons to total axon area). p < 0.0001 (one-way ANOVA with Dunnett correction). Results represent the mean + SEM. *p < 0.05 versus control +NT (one-way ANOVA with Dunnett correction); n = 27–36 axonal fields from 5 experiments. Quantification for cycloheximide is not significantly different from anisomycin. C, Axons in the presence (+NT; right) and absence (−NT; left) of neurotrophins stained for activated caspase6. Caspase6 activation is detected in axons severed from cell bodies (no CB) or treated with anisomycin or cycloheximide. Scale bar, 40 μm. D, Quantification of activated caspase6 in DA shown in C. Results represent the mean + SEM. p = 0.03 (one-way ANOVA with Dunnett correction). *p < 0.05 versus control + NT (one-way ANOVA with Dunnett correction); n = 17–24 axonal fields from 3 experiments. Quantification for cycloheximide is not significantly different from anisomycin.
Figure 8.
Figure 8.
Axonal Bclw binds to Bax and prevents axon degeneration and caspase6 activation. A, Western blot for His after selective introduction of His-tagged Bclw protein into distal axons (DA) of DRG neurons grown in compartmented chamber cultures. B, Tuj1-labeled axons after introduction of β-galactosidase (β-gal) protein or Bclw protein to DA after 24 h neurotrophin deprivation (−NT). Scale bar, 40 μm. C, Quantification of axonal degeneration after introduction of β-gal or Bclw protein to DA after removal of NT. All data show mean + SEM. p = 0.0018 (one-way ANOVA with Bonferroni correction). *p < 0.05 (one-way ANOVA with Bonferroni correction); n = 19–36 axonal fields from 4 experiments. D, Western blot for His after selective introduction of His-tagged Bclw protein into cell bodies (CB). E, Tuj1-labeled axons after introduction of β-galactosidase (β-gal) protein or Bclw protein to CB after 24 h neurotrophin deprivation (−NT). Scale bar, 40 μm. F, Quantification of axonal degeneration after introduction of β-gal or Bclw protein to CB after removal of NT. Statistical analysis by one-way ANOVA. G, H, Quantification of activated caspase6 in DA after introduction of β-gal protein or Bclw protein to DA (G) or CB (H), in the presence (+NT) and absence (−NT) of neurotrophins. *p < 0.05 (one-way ANOVA with Bonferroni correction); n = 29–51 axonal fields from 4 experiments. I, Binding of His-tagged recombinant Bclw to Bax after His pulldown. J, Quantification of axonal degeneration after addition of ABT-263 to axons with Bclw protein introduced to axons. *p < 0.05 (one-way ANOVA with Bonferroni correction); n = 10–24 axonal fields from 3 experiments. K, Quantification of activated caspase6 in DA after addition of ABT-263 to axons with Bclw protein introduced to axons. *p < 0.05 (one-way ANOVA with Bonferroni correction); n = 8–17 axonal fields from 3 experiments.
Figure 9.
Figure 9.
Loss of Bclw leads to increased axon degeneration and caspase6 activation in NGF-responsive axons in vitro and in vivo. A, Quantification of axonal degeneration after introduction of Bclw protein to DA of bclw−/− after removal of NT. Data is represented by the mean + SEM. p < 0.0001 (one-way ANOVA). *p < 0.05 (one-way ANOVA). B, Tuj1-labeled axons and activated caspase6 staining from bclw+/+, bclw−/−, and bclw−/− axons transfected with recombinant Bclw protein (+Bclw) in DRG neurons grown in compartmented chamber cultures in absence of NT. Scale bar, 40 μm. C, Quantification of activated caspase6 in DA shown in B. p = 0.009 (ANOVA with Bonferroni correction). *p < 0.05 (ANOVA with Bonferroni correction). †p < 0.1 (ANOVA with Bonferroni correction); n = 38 axonal fields from 3 bclw+/+ mice, n = 39 axonal fields from 3 bclw−/− mice, and n = 28 axonal fields from 3 bclw−/− mice transfected with recombinant Bclw protein. D, Six-month-old bclw−/− mice show increased activated caspase6 staining in axons innervating the skin, costained with Tuj1. Scale bars, 50 μm. E, Quantification of activated caspase6 in axons of 6-month-old bclw−/− and bclw+/+ mice. All data show mean + SEM. *p < 0.05 (Student's t test); n = 3 animals per genotype, 3–5 sections per animal. F, Six-month-old bclw−/− mice show increased caspase6 staining in substance P-positive fibers innervating the skin. Scale bars, 50 μm. G, Quantification of activated caspase6 in substance P-positive axons of 6-month-old bclw−/− and bclw+/+ mice. *p < 0.05 (Student's t test); n = 3 animals per genotype, 3–5 sections per animal.

Similar articles

Cited by

References

    1. Andreassi C, Riccio A. To localize or not to localize: mRNA fate is in 3′UTR ends. Trends Cell Biol. 2009;19:465–474. - PubMed
    1. Andreassi C, Zimmermann C, Mitter R, Fusco S, Devita S, Saiardi A, Riccio A. An NGF-responsive element targets myo-inositol monophosphatase-1 mRNA to sympathetic neuron axons. Nat Neurosci. 2010;13:291–301. - PubMed
    1. Brumovsky P, Villar MJ, Hökfelt T. Tyrosine hydroxylase is expressed in a subpopulation of small dorsal root ganglion neurons in the adult mouse. Exp Neurol. 2006;200:153–165. - PubMed
    1. Campenot RB. Development of sympathetic neurons in compartmentalized cultures: II. Local control of neurite survival by nerve growth factor. Dev Biol. 1982;93:13–21. - PubMed
    1. Chen CY, Ezzeddine N, Shyu AB. Messenger RNA half-life measurements in mammalian cells. Methods Enzymol. 2008;448:335–357. - PMC - PubMed

Publication types

MeSH terms