. 2013 Mar 20;33(12):5162-74.
doi: 10.1523/JNEUROSCI.5442-12.2013.

Postnatal loss of P/Q-type channels confined to rhombic-lip-derived neurons alters synaptic transmission at the parallel fiber to purkinje cell synapse and replicates genomic Cacna1a mutation phenotype of ataxia and seizures in mice

Affiliations

Postnatal loss of P/Q-type channels confined to rhombic-lip-derived neurons alters synaptic transmission at the parallel fiber to purkinje cell synapse and replicates genomic Cacna1a mutation phenotype of ataxia and seizures in mice

Takashi Maejima et al. J Neurosci. .

Abstract

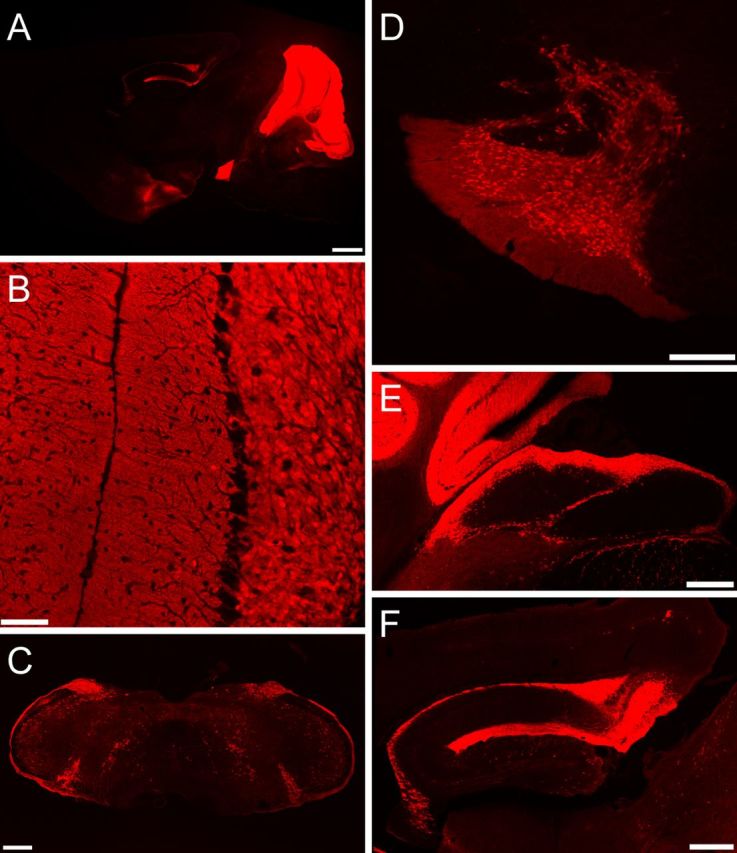
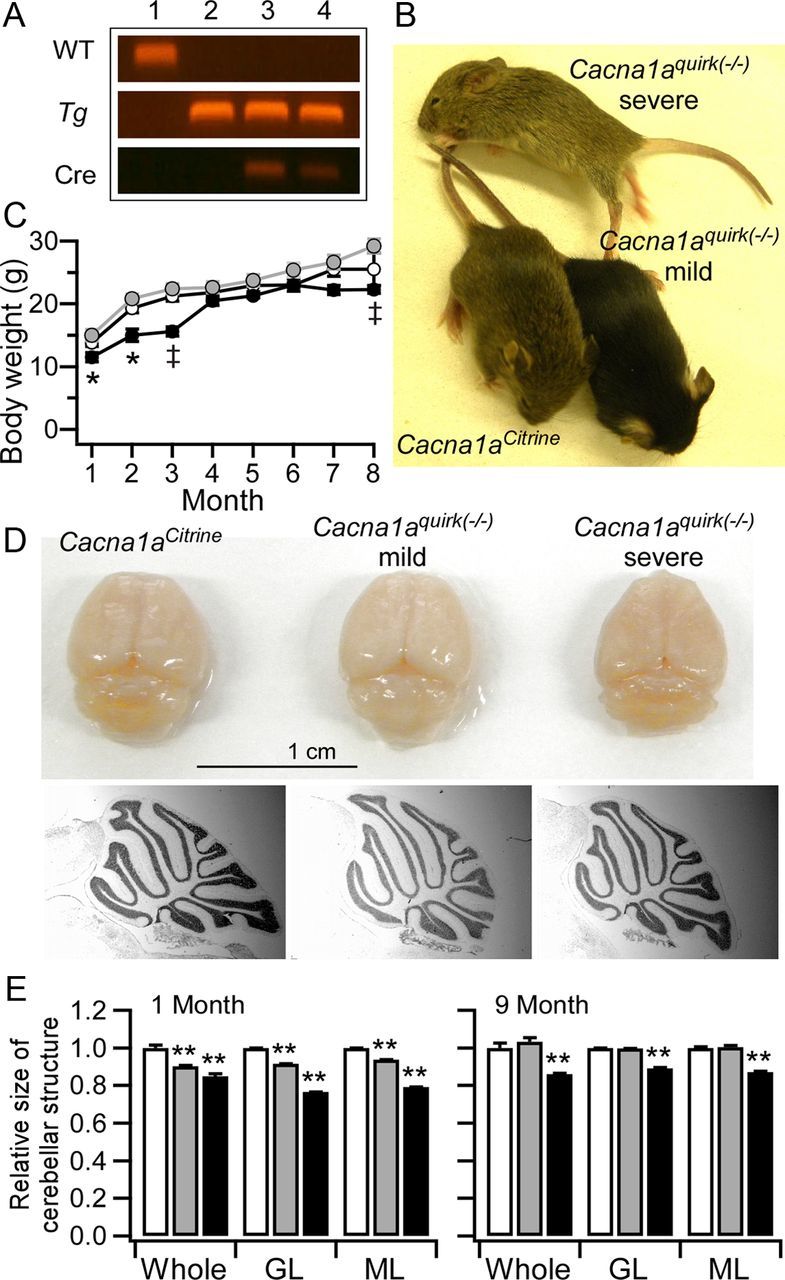
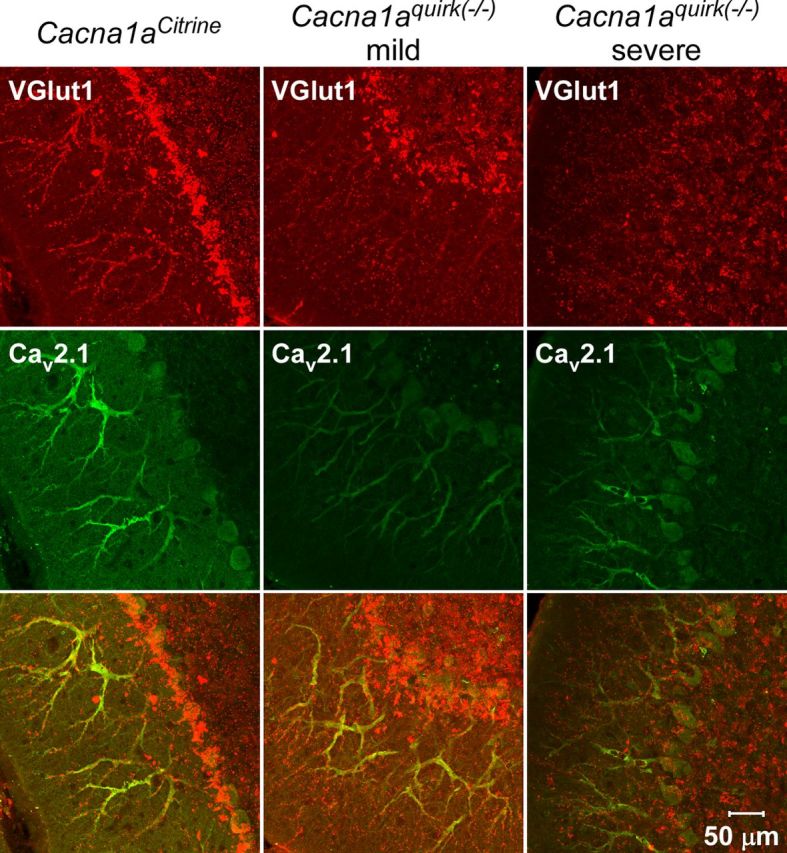
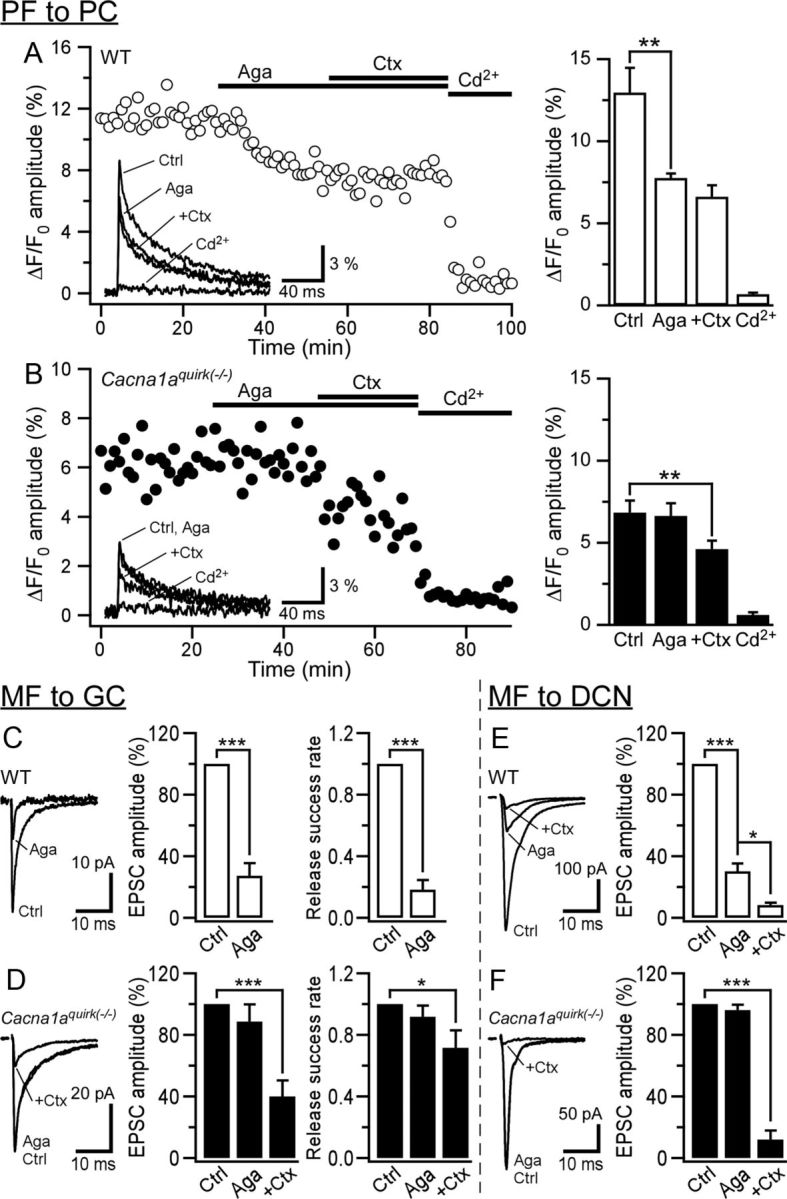
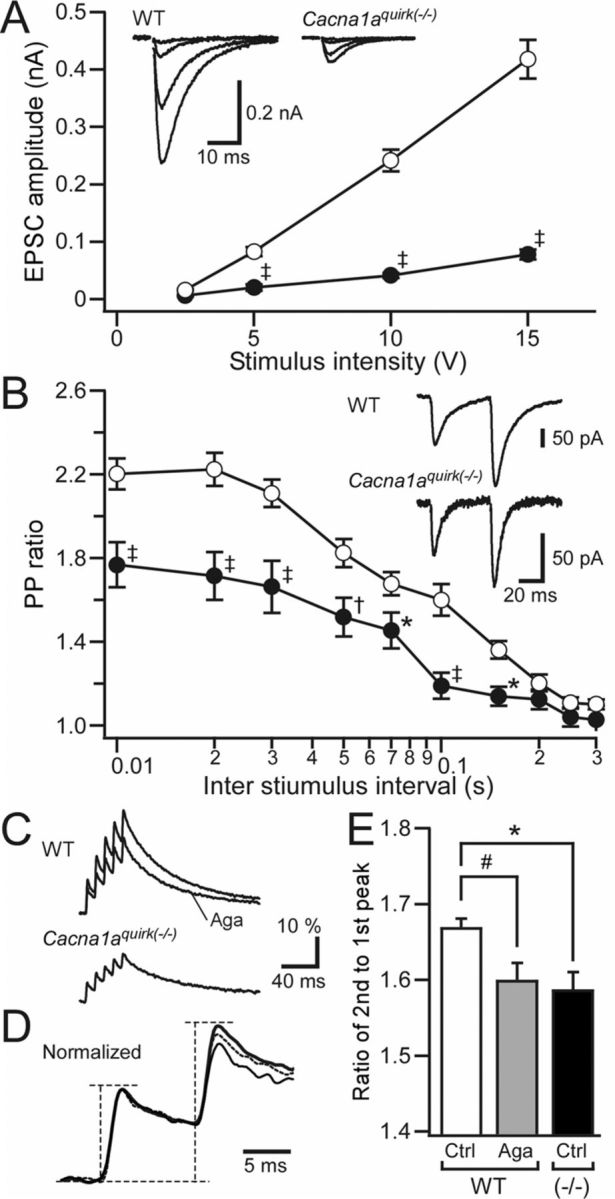
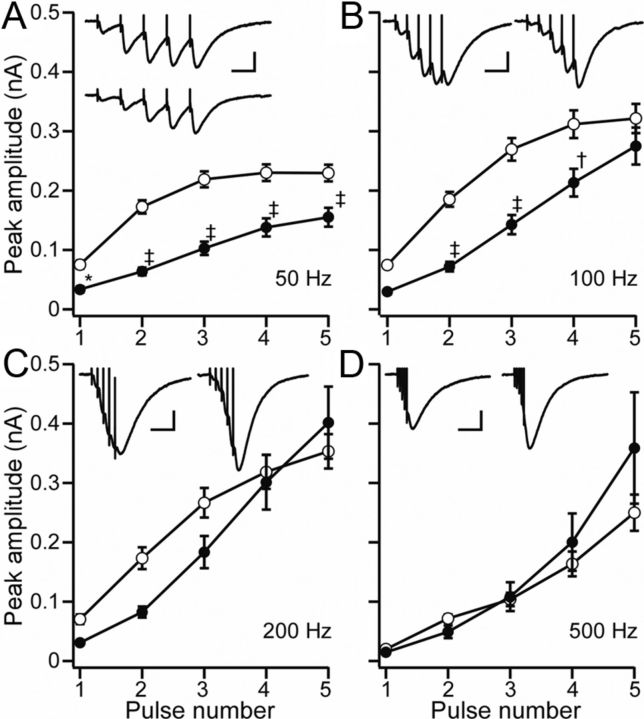
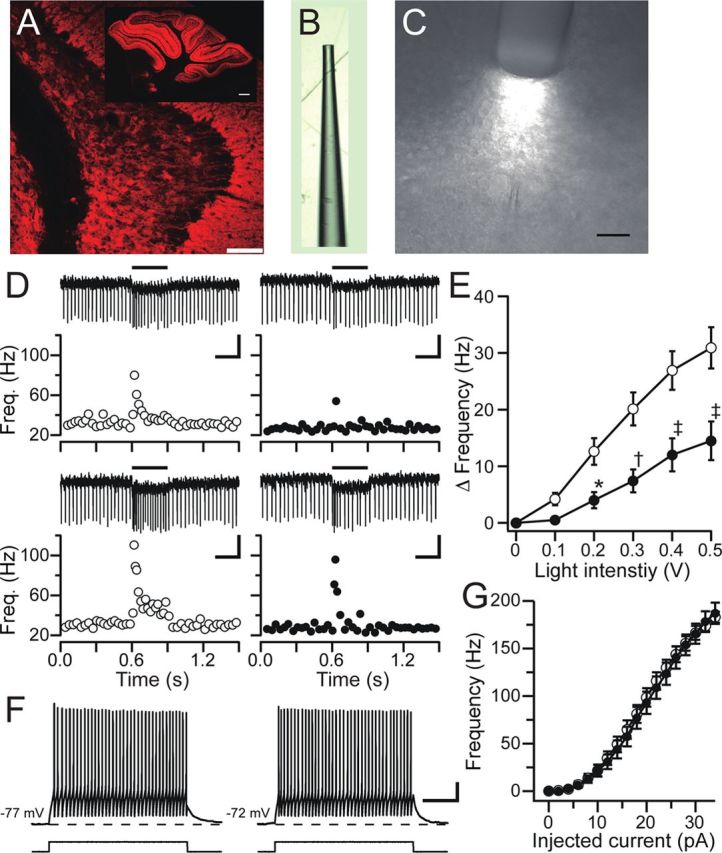
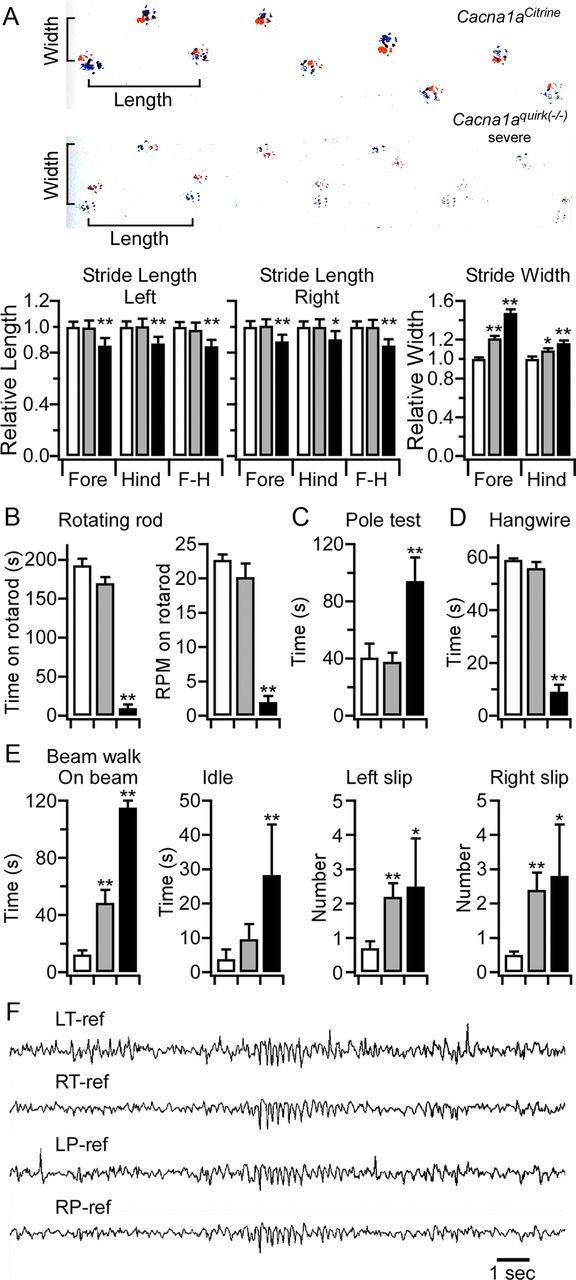
Ataxia, episodic dyskinesia, and thalamocortical seizures are associated with an inherited loss of P/Q-type voltage-gated Ca(2+) channel function. P/Q-type channels are widely expressed throughout the neuraxis, obscuring identification of the critical networks underlying these complex neurological disorders. We showed recently that the conditional postnatal loss of P/Q-type channels in cerebellar Purkinje cells (PCs) in mice (purky) leads to these aberrant phenotypes, suggesting that intrinsic alteration in PC output is a sufficient pathogenic factor for disease initiation. The question arises whether P/Q-type channel deletion confined to a single upstream cerebellar synapse might induce the pathophysiological abnormality of genomically inherited P/Q-type channel disorders. PCs integrate two excitatory inputs, climbing fibers from inferior olive and parallel fibers (PFs) from granule cells (GCs) that receive mossy fiber (MF) input derived from precerebellar nuclei. In this study, we introduce a new mouse model with a selective knock-out of P/Q-type channels in rhombic-lip-derived neurons including the PF and MF pathways (quirky). We found that in quirky mice, PF-PC synaptic transmission is reduced during low-frequency stimulation. Using focal light stimulation of GCs that express optogenetic light-sensitive channels, channelrhodopsin-2, we found that modulation of PC firing via GC input is reduced in quirky mice. Phenotypic analysis revealed that quirky mice display ataxia, dyskinesia, and absence epilepsy. These results suggest that developmental alteration of patterned input confined to only one of the main afferent cerebellar excitatory synaptic pathways has a significant role in generating the neurological phenotype associated with the global genomic loss of P/Q-type channel function.


Figures

Figure 1.
Figure 1.
Characterization of Cre-recombination pattern with the Gabra6-Cre driver line. Gabra6-Cre driver line was crossed with the td-Tomato reporter line. td-Tomato fluorescence identifies neurons and their axons in which Cre-dependent recombination occurred. A, Parasagittal section of whole brain. B, Parasagittal section of the cerebellar cortex. C, Coronal section of the medulla. External cuneate nucleus, lateral reticular nucleus, and scattered cells in the spinal trigeminal nucleus are positive. D, Sagittal section showing pontine nuclei and reticulotegmental nucleus of the pons. E, Parasagittal section of the dorsal cochlear nucleus. F, Clustered neurons in the parasubiculum. Scattered cells in the dentate granule layer can be seen. Scale bars: A, 800 μm; B, 50 μm; C, 400 μm; D, E, 200 μm; F, 400 μm.
Figure 2.
Figure 2.
Conditional knock-down of P/Q-type channels in GCs and precerebellar nucleus neurons reveals changes in cerebellar morphology. A, PCR analysis for distinction between wild-type (WT; 1), Cacna1aCitrine mice (2), and Cacna1aquirk(−/−) mice (3 and 4 from mild and severe mice, respectively) by 3 different primer sets detecting to Cacna1a (WT), Cacna1aCitrine (Tg), and Cre recombinase (Cre) sequences. B, Phenotypic differences among Cacna1aCitrine mice, Cacna1aquirk(−/−) mild, and Cacna1aquirk(−/−) severe mice. C, Comparison of body weight gain. Average weights of Cacna1aCitrine mice (6 females [F], 9 males [M]), Cacna1aquirk(−/−) mild (4 F, 8 M), and Cacna1aquirk(−/−) severe mice (11 F, 10 M) were plotted at 1 month of age. *p < 0.05, p < 0.001 (ANOVA). D, Comparison of brains and the cerebellar structure of Cacna1aCitrine and Cacna1aquirk(−/−) mild and Cacna1quirk(−/−) severe mice at 6 months of age. Parasagittal sections of cerebellar vermis were stained with cresyl violet. E, Relative size of cerebellar structures. Shown are: area of cerebellar slices (whole), granular layers (GL), and molecular layers (ML) determined in Cacna1aCitrine (white bar), Cacna1aquirk(−/−) mild (gray bar), and Cacna1aquirk(−/−) severe (black bar) mice at 1 month (left) and 9 months (right) of age. The area of sagittal cerebellar sections (n = 6 slices × 3 mice) and the thickness of the molecular and granular layers (n = 6 areas × 6 slices × 3 mice) were measured for each line. *p < 0.05; **p < 0.01 (ANOVA).
Figure 3.
Figure 3.
Loss of P/Q-type channel protein in Cacna1aquirk(−/−) mice. Comparison of P/Q-type channel protein expression in parallel fibers between adult Cacna1aCitrine and Cacna1aquirk(−/−) mice. Cerebellar slices were incubated with primary antibodies against VGlut1 (PF synapse marker in red, top) and P/Q-type channels (green, middle). The bottom panel is a merger between the top and middle panels.
Figure 4.
Figure 4.
Loss of P/Q-type channel contribution for presynaptic Ca2+ influx at parallel fiber to PC synapse and for synaptic transmission at MFs to GCs and DCN neurons in Cacna1aquirk(−/−) mice. A, B, Time course of peak fluorescent transients (ΔF/F0) evoked by a single stimulation of the PF tract in the presence of the Ca2+ channel blockers 0.2 μm Aga-IVA (Aga), 1 μm Ctx-GVIA (Ctx), and 0.3 mm Cd2+ in control mice (A) and in Cacna1aquirk(−/−) mice (B). Inset, Fluorescent transients obtained in the presence of the indicated Ca2+ channel blockers. Bars, Summary of the effects of Ca2+ channel blockers on the fluorescence transients in control mice (n = 5; white) and in Cacna1aquirk(−/−) mice (n = 5; black). C, D, P/Q-type channel contribution for synaptic transmission at MF-GC synapses in control (n = 5 cells; C) and in Cacna1aquirk(−/−) mice (n = 7 cells; D). Traces. Averaged non-NMDA-receptor-mediated EPSCs obtained in the presence of the Ca2+ channel blockers. Summary bars show changes in the relative amplitude of EPSCs (% of control; left bars) and the vesicle-release rate (right bars) by the indicated blockers. E, F, Comparison at MF-DCN neuron synapses in control (n = 6 cells; E) and in Cacna1aquirk(−/−) mice (n = 5 cells; F). *p < 0.05; **p < 0.01; ***p < 0.001 (ANOVA).
Figure 5.
Figure 5.
Loss of P/Q-type channel in cerebellar GC reduces synaptic input and changes PPF at parallel fiber to PC synapse. A, Averaged input (stimulus intensity) to output (EPSC amplitude) relationship of PF-PC synaptic transmission in control (white circles; n = 22 cells) and in Cacna1aquirk(−/−) mice (black circles; n = 28 cells). Inset, Representative traces of PF-EPSCs evoked at each stimulus intensity. B, Averaged paired-pulse ratio (second to first EPSC amplitude) are plotted as a function of interstimulus interval in control (white circles; n = 18 cells) and in Cacna1aquirk(−/−) mice (black circles; n = 15 cells). Inset, Representative traces of PF-EPSCs evoked by a paired stimuli (50 ms interval). *p < 0.05; p < 0.01; p < 0.001 (ANOVA). C, Representative fluorescence transients (ΔF/F0; average of 8 consecutive traces) elicited by a train of five stimuli of PF fiber tract (100 Hz) in control (top) and Cacna1aquirk(−/−) (bottom) mice. The fluorescence transient acquired during 0.2 μm Aga-IVA (Aga) application is superimposed in control mice. D, Normalized fluorescence traces to the first peak of each trace. The three traces shown in C are normalized and superimposed. Thick line is a control trace in control mice; dashed line, trace obtained during Aga-IVA application in control mice; thin line, control trace in Cacna1aquirk(−/−) mice. E, Ratio of second peak to first peak of transients summarized in each condition (all, n = 5). #p < 0.05 (paired t test); *p < 0.05 (t test).
Figure 6.
Figure 6.
High-frequency activity reveals robust synaptic transmission at the PF-PC synapse in Cacna1aquirk(−/−) mice. Analysis of 5 PF-EPSC trains evoked by different frequencies: 50 Hz (A), 100 Hz (B), 200 Hz (C), and 500 Hz (D). Each peak after stimulus artifacts is detected and the amplitude from baseline is simply plotted against the pulse number. The averages ± SEM are shown for control mice (white circles; n = 9 cells) and Cacna1aquirk(−/−) mice (black circles; n = 8 cells). Inset, Representative traces of PF-EPSCs obtained in a same cell from each genotype. A, top, and B–D, left, Control mice. A, bottom, and B–D, right, Cacna1aquirk(−/−) mice. Scale bars, 100 pA and 20 ms. *p < 0.05; p < 0.01; p < 0.001 (ANOVA).
Figure 7.
Figure 7.
Optical fiber-guided focal stimulation of GCs with Chr2 and the effects on PC spiking. A, Sagittal section showing ChR2-mCherry expression in cerebellar GCs after injection of Cre-dependent AAV2 into cerebellum of TgGabra6-cre mice. B, Image of the quartz glass optical fiber with a blunt end tip (tip outer diameter, ∼35 μm) that was used for focal light application. C, Placement of an optical fiber and a recording pipette within a cerebellar slice. The optical fiber was placed in GC layer right beneath a recorded PC soma (50 μm apart). Light intensity was monitored at the outlet of the optical fiber (30 × 30 μm) by a photomultiplier. D, Example trace (upper) and time course of corresponding instantaneous frequency (bottom plot) of PC spontaneous firing obtained by extracellular recordings in cerebellar slices of control TgGabra6-cre mice (left column, white plots) and Cacna1aquirk(−/−) mice (right column, black plots) are shown in each panel. A lower-intensity (0.2 V read by a photomultiplier; upper panels) or a higher-intensity (0.5 V; lower panels) light pulse was flashed at the time indicated by black bars (300 ms long, 470 nm). E, Plots showing the averaged input (light intensity) to output (change in PC spike frequency) relationship in control TgGabra6-cre mice (white circles; n = 25 cells) and in Cacna1aquirk(−/−) mice (black circles; n = 21 cells). The change in frequency was determined by subtracting the baseline frequency from the averaged frequency obtained in light-illumination. F, Example traces of voltage responses to injected current (22 pA, 400 ms) in GCs obtained from 3-week-old control (left) and Cacna1aquirk(−/−) (right) mice. G, Averaged input (injected current) to output (spike frequency) relationship of GC membrane responses in control (white circles; n = 16 cells) and in Cacna1aquirk(−/−) mice (black circles; n = 21 cells). *p < 0.05; p < 0.01; p < 0.001 (ANOVA). Scale bars: A, 50 μm, inset 300 μm; C, 20 μm; D, 200 μV, 200 ms; F, 20 mV, 100 ms.
Figure 8.
Figure 8.
Behavioral analysis and absence epilepsy of Cacna1aquirk(−/−) mice. Comparisons are shown for Cacna1aCitrine mice (white bar), Cacna1aquirk(−/−) mild mice (gray bar), and Cacna1aquirk(−/−) severe mice (black bar) for results from the following tests: (A) footprint, (B) rotarod, (C) pole test, (D) hang wire, and (E) beam walk. The details of the analysis and the number of mice tested are described in the Materials and Methods. *p < 0.05; **p < 0.01 (ANOVA). F, Spontaneous electrocorticographic spike-wave discharge activity recorded from awake adult Cacna1aquirk(−/−) mice. Traces from left and right temporal (LT and RT) and left and right parietal (LP and RP) hemispheres show bilateral, spike-wave synchronous discharge during behavioral arrest. Intermittent interictal EEG spike discharges are also present.

Similar articles

Cited by

References

    1. Alviña K, Khodakhah K. KCa channels as therapeutic targets in episodic ataxia type-2. J Neurosci. 2010;30:7249–7257. - PMC - PubMed
    1. Bilovocky NA, Romito-DiGiacomo RR, Murcia CL, Maricich SM, Herrup K. Factors in the genetic background suppress the engrailed-1 cerebellar phenotype. J Neurosci. 2003;23:5105–5112. - PMC - PubMed
    1. Bosman LW, Konnerth A. Activity-dependent plasticity of developing climbing fiber-Purkinje cell synapses. Neuroscience. 2009;162:612–623. - PubMed
    1. Brozoski TJ, Ciobanu L, Bauer CA. Central neural activity in rats with tinnitus evaluated with manganese-enhanced magnetic resonance imaging (MEMRI) Hear Res. 2007;228:168–179. - PubMed
    1. Calderon DP, Fremont R, Kraenzlin F, Khodakhah K. The neural substrates of rapid-onset Dystonia-Parkinsonism. Nat Neurosci. 2011;14:357–365. - PMC - PubMed

Publication types

MeSH terms

Substances

LinkOut - more resources