Effects of sugar-sweetened beverages on plasma acylation stimulating protein, leptin and adiponectin: relationships with metabolic outcomes
- PMID: 23512943
- PMCID: PMC3732502
- DOI: 10.1002/oby.20437
Effects of sugar-sweetened beverages on plasma acylation stimulating protein, leptin and adiponectin: relationships with metabolic outcomes
Abstract
Objective: The effects of fructose and glucose consumption on plasma acylation stimulating protein (ASP), adiponectin, and leptin concentrations relative to energy intake, body weight, adiposity, circulating triglycerides, and insulin sensitivity were determined.
Design and methods: Thirty two overweight/obese adults consumed glucose- or fructose-sweetened beverages (25% energy requirement) with their ad libitum diets for 8 weeks, followed by sweetened beverage consumption for 2 weeks with a standardized, energy-balanced diet. Plasma variables were measured at baseline, 2, 8, and 10 weeks, and body adiposity and insulin sensitivity at baseline and 10 weeks.
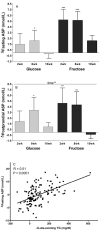
Results: Fasting and postprandial ASP concentrations increased at 2 and/or 8 weeks. ASP increases correlated with changes in late-evening triglyceride concentrations. At 10 weeks, fasting adiponectin levels decreased in both groups, and decreases were inversely associated with baseline intra-abdominal fat volume. Sugar consumption increased fasting leptin concentrations; increases were associated with body weight changes. The 24-h leptin profiles increased during glucose consumption and decreased during fructose consumption. These changes correlated with changes of 24-h insulin levels.
Conclusions: The consumption of fructose and glucose beverages induced changes in plasma concentrations of ASP, adiponectin, and leptin. Further study is required to determine if these changes contribute to the metabolic dysfunction observed during fructose consumption.
Copyright © 2013 The Obesity Society.
Figures


Comment in
-
Effect of fructose vs. glucose on acylation stimulating protein, leptin, and adiponectin lacks relevance.Obesity (Silver Spring). 2014 Jan;22(1):2. doi: 10.1002/oby.20551. Epub 2013 Sep 17. Obesity (Silver Spring). 2014. PMID: 23818400 No abstract available.
Similar articles
-
Endocrine and metabolic effects of consuming fructose- and glucose-sweetened beverages with meals in obese men and women: influence of insulin resistance on plasma triglyceride responses.J Clin Endocrinol Metab. 2009 May;94(5):1562-9. doi: 10.1210/jc.2008-2192. Epub 2009 Feb 10. J Clin Endocrinol Metab. 2009. PMID: 19208729 Free PMC article. Clinical Trial.
-
Moderate amounts of fructose- or glucose-sweetened beverages do not differentially alter metabolic health in male and female adolescents.Am J Clin Nutr. 2014 Sep;100(3):796-805. doi: 10.3945/ajcn.113.081232. Epub 2014 Jul 16. Am J Clin Nutr. 2014. PMID: 25030782 Free PMC article. Clinical Trial.
-
Consuming fructose-sweetened, not glucose-sweetened, beverages increases visceral adiposity and lipids and decreases insulin sensitivity in overweight/obese humans.J Clin Invest. 2009 May;119(5):1322-34. doi: 10.1172/JCI37385. Epub 2009 Apr 20. J Clin Invest. 2009. PMID: 19381015 Free PMC article.
-
Endocrine and metabolic effects of consuming beverages sweetened with fructose, glucose, sucrose, or high-fructose corn syrup.Am J Clin Nutr. 2008 Dec;88(6):1733S-1737S. doi: 10.3945/ajcn.2008.25825D. Am J Clin Nutr. 2008. PMID: 19064538 Free PMC article. Review.
-
Control of energy homeostasis and insulin action by adipocyte hormones: leptin, acylation stimulating protein, and adiponectin.Curr Opin Lipidol. 2002 Feb;13(1):51-9. doi: 10.1097/00041433-200202000-00008. Curr Opin Lipidol. 2002. PMID: 11790963 Review.
Cited by
-
Pathophysiology of Non Alcoholic Fatty Liver Disease.Int J Mol Sci. 2016 Dec 11;17(12):2082. doi: 10.3390/ijms17122082. Int J Mol Sci. 2016. PMID: 27973438 Free PMC article. Review.
-
Effect of Dietary Sugar Intake on Biomarkers of Subclinical Inflammation: A Systematic Review and Meta-Analysis of Intervention Studies.Nutrients. 2018 May 12;10(5):606. doi: 10.3390/nu10050606. Nutrients. 2018. PMID: 29757229 Free PMC article. Review.
-
Tolerable upper intake level for dietary sugars.EFSA J. 2022 Feb 28;20(2):e07074. doi: 10.2903/j.efsa.2022.7074. eCollection 2022 Feb. EFSA J. 2022. PMID: 35251356 Free PMC article.
-
Puberty Status Modifies the Effects of Genetic Variants, Lifestyle Factors and Their Interactions on Adiponectin: The BCAMS Study.Front Endocrinol (Lausanne). 2021 Dec 24;12:737459. doi: 10.3389/fendo.2021.737459. eCollection 2021. Front Endocrinol (Lausanne). 2021. PMID: 35002951 Free PMC article.
-
High Dietary Fructose: Direct or Indirect Dangerous Factors Disturbing Tissue and Organ Functions.Nutrients. 2017 Mar 29;9(4):335. doi: 10.3390/nu9040335. Nutrients. 2017. PMID: 28353649 Free PMC article. Review.
References
-
- Havel PJ. Update on adipocyte hormones; regulation of energy balance and carbohydrate/lipid metabolism. Diabetes. 2004;53:S143–S151. - PubMed
-
- Cianflone K, Xia Z, Chen LY. Critical review of acylation-stimulating protein physiology in humans and rodents. Biochimica et Biophysica Acta. 2003;1609:127–143. - PubMed
-
- Germinario R, Sniderman AD, Manuel S, Pratt Lefebvre S, Baldo A, Cianflone K. Coordinate regulation of triacylglycerol synthesis and glucose transport by acylation-stimulating protein. Metabolism. 1993;42:574–580. - PubMed
-
- Yarsuel Z, Cianflone K, Sniderman AD, Rosenbloom M, Walsh M, Rodrigez MA. Effect of acylation stimulating protein on the triacylglycerol synthetic pathway of human adipose tissue. Lipids. 1991;16:495–499. - PubMed
Publication types
MeSH terms
Substances
Grants and funding
LinkOut - more resources
Full Text Sources
Other Literature Sources
Miscellaneous

