. 2013 Apr 26;288(17):12161-74.
doi: 10.1074/jbc.M113.464552. Epub 2013 Mar 18.

Negative regulation of 26S proteasome stability via calpain-mediated cleavage of Rpn10 subunit upon mitochondrial dysfunction in neurons

Affiliations

Negative regulation of 26S proteasome stability via calpain-mediated cleavage of Rpn10 subunit upon mitochondrial dysfunction in neurons

Qian Huang et al. J Biol Chem. .

Abstract

Proteasomal and mitochondrial dysfunctions are implicated in chronic neurodegenerative diseases. To investigate the impact of mitochondrial impairment on the proteasome, we treated rat cerebral cortical neurons with oligomycin, antimycin, or rotenone, which inhibit different elements of the electron transport chain. Firstly, we observed a reduction in ubiquitinated proteins and E1 activity. Secondly, we established that 26S proteasomes are disassembled with a decline in activity. Thirdly, we show, to our knowledge for the first time, that calpain activation triggers the selective processing of the 26S proteasome subunit Rpn10. Other proteasome subunits tested were not affected. Calpain also cleaved caspase 3 to an inactive fragment, thus preventing apoptosis that is an energy-dependent cell death pathway. In addition, calpain cleaved the microtubule-associated protein Tau, a major component of neurofibrillary tangles in Alzheimer disease and other tauopathies. Fourthly, we detected a rise in 20S proteasome levels and activity. Finally, we show that both acute (16 h) and long term (up to 7 days) mitochondrial impairment led to down-regulation of ubiquitinated-proteins, 26S proteasome disassembly, and a rise in 20S proteasomes. We postulate that upon mitochondrial dysfunction, ATP depletion and calpain activation contribute to the demise of protein turnover by the ubiquitin/proteasome pathway. The concomitant rise in 20S proteasomes, which seem to degrade proteins in an unregulated and energy-independent manner, in the short term may carry out the turnover of randomly unfolded oxidized proteins. However, if chronic, it could lead to neurodegeneration as regulated protein degradation by the ubiquitin/proteasome pathway is essential for neuronal survival.


Figures
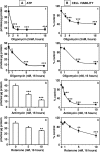
FIGURE 1.
FIGURE 1.
Effects of oligomycin, antimycin and rotenone on ATP levels and viability in rat cerebral cortical neurons. Neurons were treated with oligomycin (panels 1 and 2), antimycin (panels 3), and rotenone (panels 4) for the times and concentrations indicated. A, ATP steady state levels (pmol/μg of protein) were assessed with the luciferin/luciferase system. B, cell viability was assessed with the MTT assay. The percentages represent the ratio between the data for each condition and control (100%). Values indicate means and S.E. from at least three experiments per group. Asterisks identify values that are significantly different from control (*, p < 0.05; **, p < 0.01; ***, p < 0.001).
FIGURE 2.
FIGURE 2.
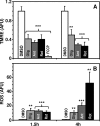
Effects of oligomycin (Olig), antimycin (Ant), and rotenone (Rot) on mitochondrial membrane potential ΔΨm and ROS in rat cerebral cortical neurons. Neurons were treated with oligomycin (5 nm), antimycin (5 nm), and rotenone (10 nm) for the times indicated. A, ΔΨm was assessed with TMRE. The effect of the uncoupler carbonyl cyanide p-trifluoromethoxyphenylhydrazone (FCCP) is shown for comparison. AFU, arbitrary fluorescent units. B, ROS was assessed with H2DCFDA. Total fluorescence from cells was quantified in each image field using ImageJ. Values (arbitrary fluorescent units (AFU)) indicate means and S.E. from 10–15 images per group pooled over two independent experiments for each group and normalized to time-matched DMSO (vehicle) control = 1. Asterisks identify values that are significantly different from control (**, p < 0.01; ***, p < 0.001).
FIGURE 3.
FIGURE 3.
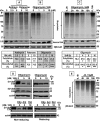
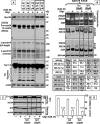
Effects of oligomycin, antimycin (Antimyc.), and rotenone on Ub proteins, monoubiquitin (MonoUb), and E1- and E2-ubiquitin thiol esters in rat cerebral cortical neurons. Neurons were treated as indicated. Total lysates were analyzed by Western blotting (30 μg of protein/lane) probed with the respective antibodies for detection of proteins as follows. A–C, Ub proteins (panels 1), free monoubiquitin (panels 2), and βIII-tubulin (βIII-tub, loading control, panels 3). D, E1-ubiquitin (E1+Ub) and E2-ubiquitin (E2+Ub) thiol esters (upper bands) and native E1 and E2 (lower bands) run under nonreducing conditions (left panels) or reducing conditions with β-mercaptoethanol (right panels); actin (loading control) was detected in panels 3 and 5. Olig, oligomycin; Ant, antimycin; Rot, rotenone. E, effect of prostaglandin J2 (15 μm; J2) on Ub proteins and βIII-tubulin (βIII-tub, loading control). Molecular mass markers in kDa are shown on the left and right. In A–C, the levels of ubiquitinated proteins (polyUb/βIII-tub) and free monoubiquitin (monoUb/βIII-tub) were semiquantified by densitometry (values in tables). Data represent the percentage of the pixel ratio for Ub proteins and free monoubiquitin over the respective loading control for each condition when compared with control (DMSO, 100%). Values are means from at least three experiments. Asterisks identify values that are significantly different from control (*, p < 0.05, **, p < 0.01, ***, p < 0.001).
FIGURE 4.
FIGURE 4.
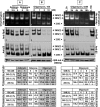
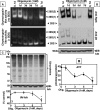
Effects of oligomycin, antimycin and rotenone on proteasome activity and levels in rat cerebral cortical neurons. A–C, neurons were treated for 16 h with antimycin (Antimyc.) or rotenone (A) or oligomycin (B) or with 5 nm oligomycin for different time points (C). Cleared lysates (30 μg/sample) were subjected to nondenaturing gel electrophoresis as described under “Experimental Procedures.” Fully assembled 26S and 20S proteasomal (indicated in the middle by arrows) chymotrypsin-like activity was assessed with Suc-LLVY-AMC by the in-gel assay (panels 1). Proteasome levels were detected by immunoblotting with anti-Rpt6 (panels 2) and anti-β5 antibodies (panels 3). Proteasome chymotrypsin-like activity and levels were semiquantified by densitometry (values in tables). The percentages represent the ratio between data for each condition and control (DMSO) considered to be 100%. Values are means from at least three experiments. Asterisks identify values that are significantly different from control (*, p < 0.05, **, p < 0.01, ***, p < 0.001).
FIGURE 5.
FIGURE 5.
Effects of oligomycin on the sedimentation velocity of proteasomes in rat cerebral cortical neurons. Total lysates (one mg protein/sample) were fractionated by glycerol density gradient centrifugation (10–40% glycerol corresponding to fractions 1–24). Aliquots (50 μl) of each fraction obtained from control- (black squares) and oligomycin- (5 nm, 8 h, white squares) treated cells were assayed for chymotrypsin-like activity with Suc-LLVY-AMC (graph). Immunoblot analyses of each fraction probed with antibodies that react with Rpt6 (19S regulatory particle, panels 1 and 3) or α5, (core particle, panels 2 and 4) are shown. Proteins were precipitated with acetone from 450 μl of each fraction. Similar results were obtained in triplicate experiments. RFU, relative fluorescent units.
FIGURE 6.
FIGURE 6.
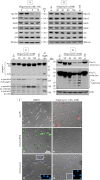
Effects of oligomycin on proteasome subunit levels, caspase 3, α-spectrin, and Tau cleavage in rat cerebral cortical neurons. Neurons were treated as indicated. Total lysates were analyzed by Western blotting (30 μg of protein/lane) probed with the respective antibodies for detection of proteins as follows. A and B, proteasome subunits (19S particle, Rpn10, Rpn2, Rpt5, and Rpt6; 20S core, α5 and β5) and βIII-tubulin (βIII-tub, loading control). C, caspase 3 (panel 1) and α-spectrin (panel 2), with the effect of prostaglandin J2 (J2) shown for comparison. D, Tau (panels 1 and 2) and actin (loading control, panel 3). Molecular mass markers in kDa are shown in the center (A and B), on the right (C), and on the left (D). Similar data were obtained in triplicate experiments. The abbreviations indicate: Pro (full-length), Cl (cleaved), and Act (active) caspase 3; Tau FL, full-length Tau; short exp., short exposure; long exp., long exposure. E, fluorescence staining with PI (panels 1 and 2), 6-CFDA (panels 3 and 4), and Hoechst (panels 5 and 6) of neurons treated as indicated. In panels 5 and 6, the nuclei of the neurons within the white boxes are magnified and shown on the bottom right of each panel. Similar results were obtained in triplicate experiments. DIC, differential interference contrast images.
FIGURE 7.
FIGURE 7.
Effects of antimycin and rotenone on Rpn10 (panel 1), Rpn11 (panel 2), caspase 3 (panel 3), α-spectrin (panel 4), and Tau cleavage (panels 5 and 6) in rat cerebral cortical neurons. Neurons were treated for 16 h with antimycin (Ant) or rotenone (Rot). Oligomycin (Olig) was included for comparison. Total lysates were analyzed by Western blotting (30 μg of protein/lane) probed with the respective antibodies. βIII-tub indicates βIII-tubulin (used as loading control). Molecular mass markers in kDa are shown in the center. Similar data were obtained in triplicate experiments. The abbreviations indicate: Pro (full-length), Cl (cleaved), and Act (active) caspase 3; Tau FL, full-length Tau; short exp., short exposure; long exp., long exposure.
FIGURE 8.
FIGURE 8.
Calpain inhibitors but not proteasome or lysosomal inhibitors prevent/diminish the effects of oligomycin on Rpn10 (panel 1), caspase 3 (panel 2), α-spectrin (panel 3), and Tau (panel 4) (A) and on proteasome activity (panel 1) and levels (panels 2 and 3) (B), but not on E1-thiol ester (C) and cell viability (D). Rat cerebral cortical neurons were pretreated for 30 min with epoxomicin (ep, proteasome inhibitor), chloroquine (CQ, lysosomal inhibitor), Cp3 (Z-Val-Phe-CHO), and calpeptin (Cpt, calpain inhibitor Z-Leu-Nle-CHO) where indicated and then with oligomycin (Oligo). Total lysates were analyzed as follows. In A and C, by Western blotting (30 μg of protein/lane) probed with the respective antibodies using actin as loading control. In A, the abbreviations indicate: panel 2, Pro (full-length) and Cl (cleaved) caspase 3; panel 4, Tau FL, full-length Tau. In C, E1-ubiquitin (E1+Ub) thiol ester (upper bands) and native E1 (lower bands) were run under nonreducing conditions (panels 1 and 2) or reducing conditions with β-mercaptoethanol (panels 3 and 4). Molecular mass markers in kDa are shown on the right. Similar data were obtained in triplicate experiments. In B, the in-gel assay (30 μg/sample) was used to assess 26S and 20S proteasome (indicated on the left by arrows) chymotrypsin-like activity (panel 1) and levels detected by immunoblotting with anti-Rpt6 (panel 2) and anti-β5 antibodies (panel 3). βIII-tub indicates βIII-tubulin, used as loading control. Proteasome chymotrypsin-like activity and levels were semiquantified by densitometry (values in tables). The percentages represent the ratio between data for each condition and control (DMSO) considered to be 100%. Values are means from at least three experiments. D, cell viability was assessed with the MTT assay. The percentages represent the ratio between the data for each condition and control (100%). Values indicate means and S.E. from eight determinations per group. Asterisks identify values that are significantly different from control (*, p < 0.05; **, p < 0.01; ***, p < 0.001). Cpt+O and Cp3+O, respective calpain inhibitors plus oligomycin.
FIGURE 9.
FIGURE 9.
Effects of long term incubations (up to 7 days) with oligomycin on rat cerebral cortical neurons. Neurons were treated with oligomycin (1 nm) up to 7 days. Total lysates were analyzed by the in-gel assay (30 μg/sample) to assess 26S and 20S proteasome chymotrypsin-like activity (panels 1 and 2) (A) and levels detected by immunoblotting with anti-Rpt6 (panel 1), anti-β5 (panel 2), and anti-βIII-tubulin (βIII-tub, loading control) antibodies (B). Arrows in the middle indicate assembled 26S and 20S proteasomes. A, panel 2, to improve detection of 20S proteasome activity, 0.04% SDS was added to the reaction buffer. In C, lysates were analyzed by Western blotting (30 μg of protein/lane) for Ub proteins. Molecular mass markers (kDa) are on the left. Ub/tub, ubiquitin/tubulin. In D, ATP steady state levels (pmol/μg of protein) were assessed with the luciferin/luciferase system. Controls in C and D (0, Olig.) represent the average between 1 and 7 days without oligomycin. Values depict the means and S.E. from at least three determinations. Asterisks identify values that are significantly different from control (*, p < 0.05; **, p < 0.01).

Similar articles

Cited by

References

    1. Livnat-Levanon N., Glickman M. H. (2011) Ubiquitin-proteasome system and mitochondria – reciprocity. Biochim. Biophys. Acta 1809, 80–87 - PubMed
    1. Ding Q., Dimayuga E., Keller J. N. (2006) Proteasome regulation of oxidative stress in aging and age-related diseases of the CNS. Antioxid. Redox Signal. 8, 163–172 - PubMed
    1. Stranahan A. M., Mattson M. P. (2012) Recruiting adaptive cellular stress responses for successful brain ageing. Nat. Rev. Neurosci. 13, 209–216 - PMC - PubMed
    1. Reddy P. H. (2007) Mitochondrial dysfunction in aging and Alzheimer's disease: strategies to protect neurons. Antioxid. Redox Signal. 9, 1647–1658 - PubMed
    1. Beal M. F. (2005) Mitochondria take center stage in aging and neurodegeneration. Ann. Neurol. 58, 495–505 - PubMed

Publication types

LinkOut - more resources