

High expression of microRNA-625-3p is associated with poor response to first-line oxaliplatin based treatment of metastatic colorectal cancer
- PMID: 23506979
- PMCID: PMC5528477
- DOI: 10.1016/j.molonc.2013.02.016
High expression of microRNA-625-3p is associated with poor response to first-line oxaliplatin based treatment of metastatic colorectal cancer
Abstract
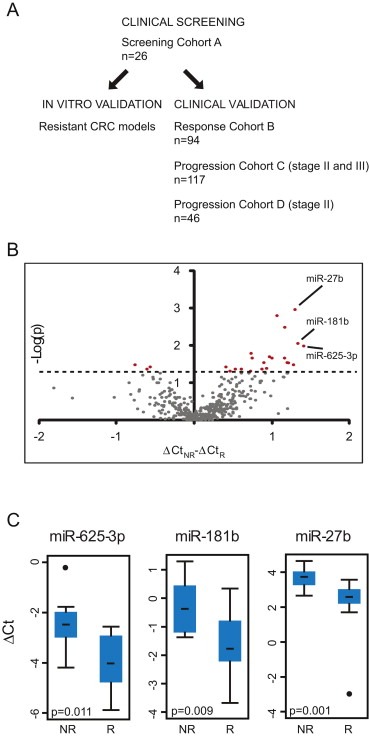
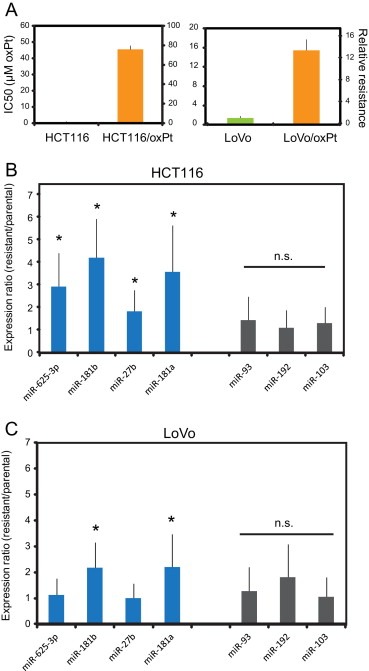
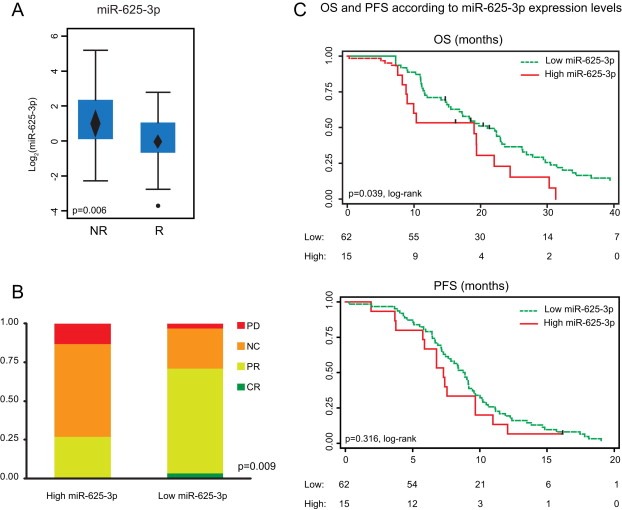
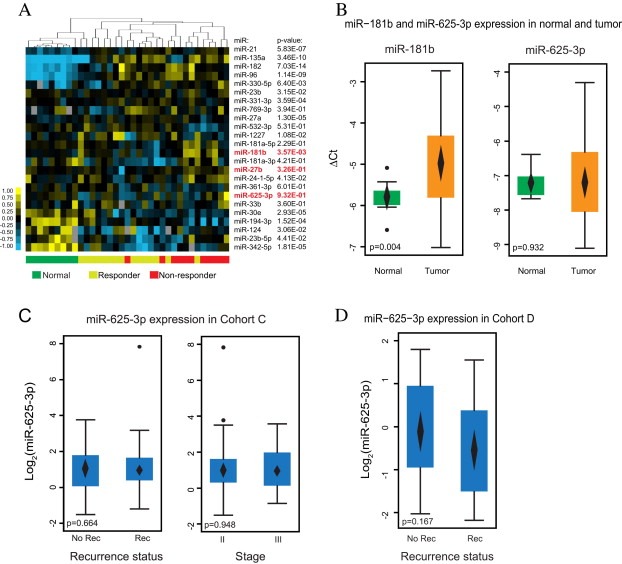
The backbone of current cytotoxic treatment of metastatic colorectal cancer (mCRC) consists of a fluoropyrimidine together with either oxaliplatin (XELOX/FOLFOX) or irinotecan (XELIRI/FOLFIRI). With an overall objective response rate of approximately 50% for either treatment combination, a major unsolved problem is that no predictors of response to these treatments are available. To address this issue, we profiled 742 microRNAs in laser-capture microdissected cancer cells from responding and non-responding patients receiving XELOX/FOLFOX as first-line treatment for mCRC, and identified, among others, high expression of miR-625-3p, miR-181b and miR-27b to be associated with poor clinical response. In a validation cohort of 94 mCRC patients treated first-line with XELOX, high expression of miR-625-3p was confirmed to be associated with poor response (OR = 6.25, 95%CI [1.8; 21.0]). Independent analyses showed that miR-625-3p was not dysregulated between normal and cancer samples, nor was its expression associated with recurrence of stage II or III disease, indicating that miR-625-3p solely is a response marker. Finally, we also found that these miRNAs were up-regulated in oxaliplatin resistant HCT116/oxPt (miR-625-3p, miR-181b and miR-27b) and LoVo/oxPt (miR-181b) colon cancer cell lines as compared with their isogenic parental cells. Altogether, our results suggest an association between miR-625-3p and response to first-line oxaliplatin based chemotherapy of mCRC.
Copyright © 2013 Federation of European Biochemical Societies. Published by Elsevier B.V. All rights reserved.
Figures
Similar articles
-
Plasma microRNAs predicting clinical outcome in metastatic colorectal cancer patients receiving first-line oxaliplatin-based treatment.Mol Oncol. 2014 Feb;8(1):59-67. doi: 10.1016/j.molonc.2013.09.001. Epub 2013 Sep 21. Mol Oncol. 2014. PMID: 24119443 Free PMC article. Clinical Trial.
-
The Plasma microRNA miR-1914* and -1915 Suppresses Chemoresistant in Colorectal Cancer Patients by Down-regulating NFIX.Curr Mol Med. 2016;16(1):70-82. doi: 10.2174/1566524016666151222144656. Curr Mol Med. 2016. PMID: 26695693
-
A multicenter phase II study of the combination of oxaliplatin, irinotecan and capecitabine in the first-line treatment of metastatic colorectal cancer.Br J Cancer. 2009 Jun 2;100(11):1720-4. doi: 10.1038/sj.bjc.6605075. Epub 2009 May 12. Br J Cancer. 2009. PMID: 19436300 Free PMC article. Clinical Trial.
-
Cetuximab plus XELIRI or XELOX for first-line therapy of metastatic colorectal cancer.Clin Colorectal Cancer. 2008 Mar;7(2):110-7. doi: 10.3816/CCC.2008.n.015. Clin Colorectal Cancer. 2008. PMID: 18501070 Review.
-
FOLFOX plus anti-epidermal growth factor receptor (EGFR) monoclonal antibody (mAb) is an effective first-line treatment for patients with RAS-wild left-sided metastatic colorectal cancer: A meta-analysis.Medicine (Baltimore). 2018 Mar;97(10):e0097. doi: 10.1097/MD.0000000000010097. Medicine (Baltimore). 2018. PMID: 29517682 Free PMC article. Review.
Cited by
-
Predictive Efficacy of MiR-125b-5p, MiR-17-5p, and MiR-185-5p in Liver Metastasis and Chemotherapy Response Among Advanced Stage Colorectal Cancer Patients.Front Oncol. 2021 May 18;11:651380. doi: 10.3389/fonc.2021.651380. eCollection 2021. Front Oncol. 2021. PMID: 34084747 Free PMC article.
-
Targeting non-coding RNAs to overcome cancer therapy resistance.Signal Transduct Target Ther. 2022 Apr 13;7(1):121. doi: 10.1038/s41392-022-00975-3. Signal Transduct Target Ther. 2022. PMID: 35418578 Free PMC article. Review.
-
Prognostic value of microRNAs in colorectal cancer: a meta-analysis.Cancer Manag Res. 2018 Apr 30;10:907-929. doi: 10.2147/CMAR.S157493. eCollection 2018. Cancer Manag Res. 2018. PMID: 29750053 Free PMC article.
-
MicroRNAs in colorectal cancer as markers and targets: Recent advances.World J Gastroenterol. 2014 Apr 21;20(15):4288-99. doi: 10.3748/wjg.v20.i15.4288. World J Gastroenterol. 2014. PMID: 24764666 Free PMC article. Review.
-
Evaluation of plasma microRNA levels to predict insensitivity of patients with advanced lung adenocarcinomas to pemetrexed and platinum.Oncol Lett. 2016 Dec;12(6):4829-4837. doi: 10.3892/ol.2016.5295. Epub 2016 Oct 19. Oncol Lett. 2016. PMID: 28101226 Free PMC article.
References
-
- Ahmad, S. , 2010. Platinum-DNA interactions and subsequent cellular processes controlling sensitivity to anticancer platinum complexes. Chem. Biodivers. 7, 543–566. - PubMed
-
- Allen, K.E. , Weiss, G.J. , 2010. Resistance may not be futile: microRNA biomarkers for chemoresistance and potential therapeutics. Mol. Cancer Ther. 9, 3126–3136. - PubMed
-
- Andersen, C.L. , Jensen, J.L. , Orntoft, T.F. , 2004. Normalization of real-time quantitative reverse transcription-PCR data: a model-based variance estimation approach to identify genes suited for normalization, applied to bladder and colon cancer data sets. Cancer Res. 64, 5245–5250. - PubMed
-
- Berezikov, E. , 2011. Evolution of microRNA diversity and regulation in animals. Nat. Rev. Genet. 12, 846–860. - PubMed
MeSH terms
Substances
Supplementary concepts
LinkOut - more resources
Full Text Sources
Other Literature Sources
Medical
