. 2013 Jan 1;2(1):e22978.
doi: 10.4161/onci.22978.

An independent endocytic pathway stimulates different monocyte subsets by the a2 N-terminus domain of vacuolar-ATPase

Affiliations

An independent endocytic pathway stimulates different monocyte subsets by the a2 N-terminus domain of vacuolar-ATPase

Christina Kwong et al. Oncoimmunology. .

Abstract

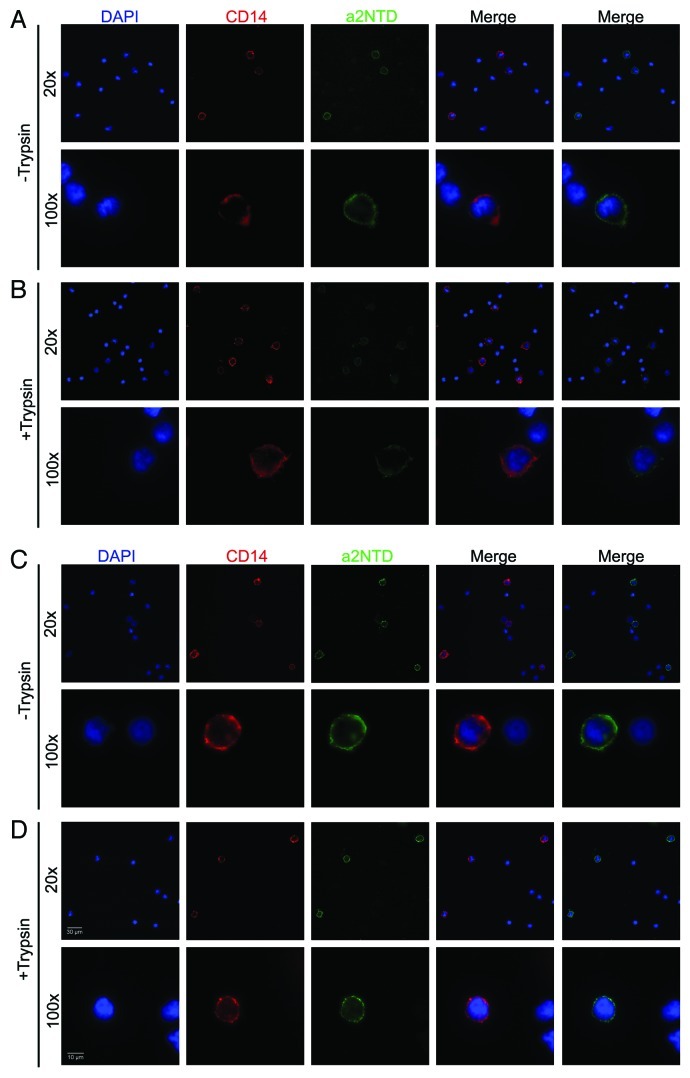
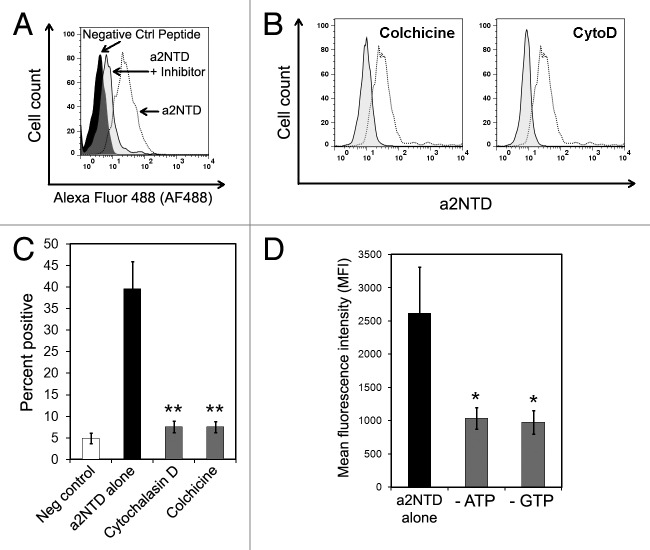
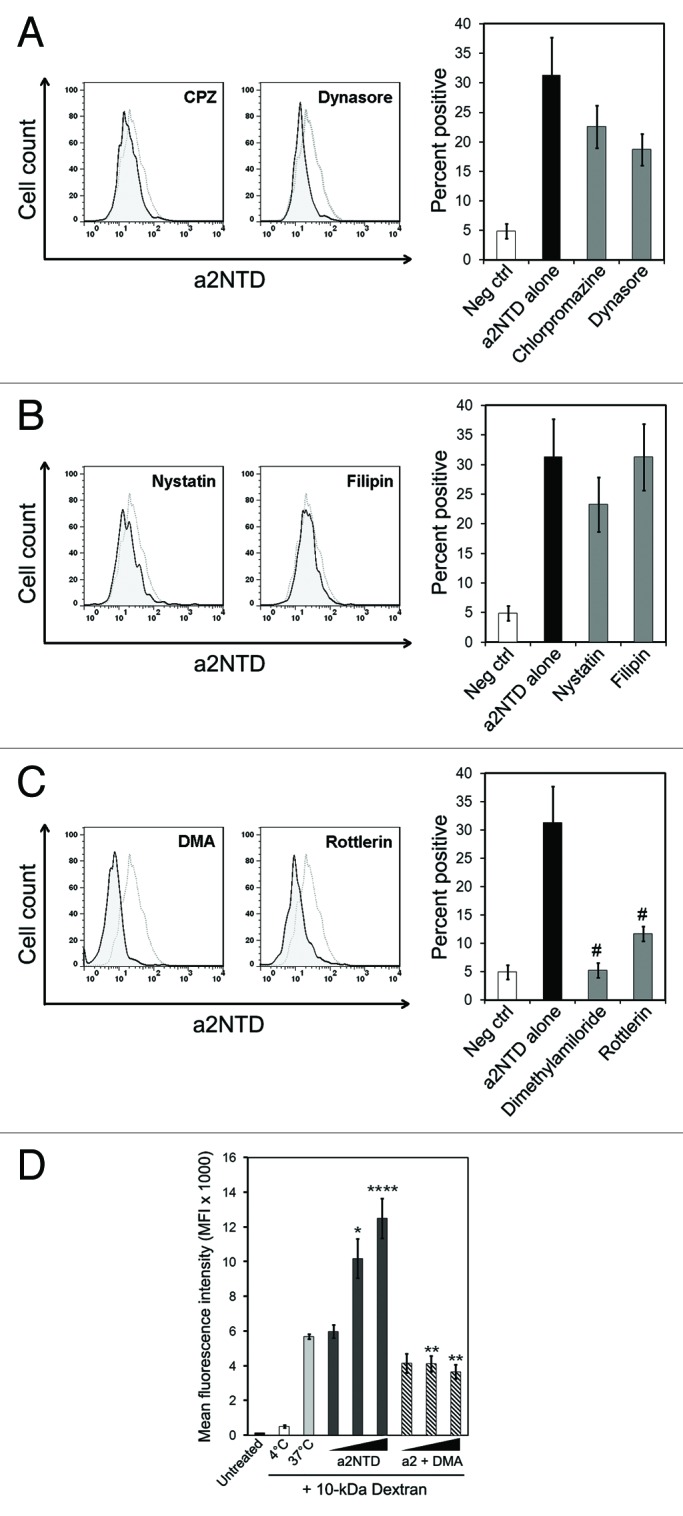
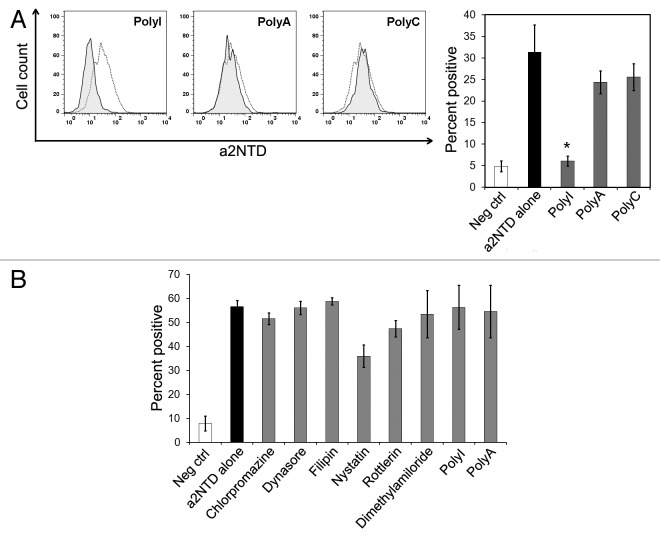
The vacuolar ATPase (V-ATPase) plays an important role in tumor progression and metastases. A novel peptide from the a2 isoform of V-ATPase called a2NTD has been shown to exert an immunoregulatory role in the tumor microenvironment by controlling the maturation of monocytes toward a tumor-associated macrophage phenotype. Our data indicate that a2NTD binds to the surface of monocytes. a2NTD was preferentially endocytosed by pro-inflammatory monocytes bearing a CD14++CD16+ phenotype, which is associated with the monocyte-to-macrophage maturation process. Both a2NTD binding and internalization led to production of the pro-inflammatory cytokines interleukin (IL)-1α and IL-1β by CD14++CD16- (classical) and CD14++CD16+ (intermediate) monocytes. a2NTD was internalized via a macropinocytosis mechanism utilizing scavenger receptors. However, the inhibition of a2NTD endocytosis did not reduce cytokine production by monocytes. This points to the existence of two receptors that respond to a2NTD: scavengers receptors that mediate cellular uptake and an hitherto unidentified receptor stimulating the production of inflammatory cytokines. Both of these monocyte receptors may be important in generating the localized inflammation that is often required to promote tumor growth and hence may constitute novel targets for the development of anticancer drugs.

Keywords: CD14; CD16; IL-1; cancer-related inflammation; pro-inflammatory monocytes; tumor associated macrophages; vacuolar ATPase.


Figures

None
Figure 1. Binding and entry of a2NTD in monocytes and lymphocytes. (A and B) Peripheral blood mononuclear cells (PBMCs) fixed with paraformaldehyde were incubated with 0.1–10 μg/mL a2NTD conjugated to Alexa Fluor 488 (a2NTD-AF488). Cell populations were gated based on forward/side scatter. Representative histograms showing a2NTD-AF488 binding in monocytes are presented in (A); the black peak refers to unstained cells. In (B), the percentage of a2NTD binding to monocytes and lymphocytes is shown (means ± SEM, n = 4). (C and D) PBMCs fixed with paraformaldehyde were incubated with 0.1–10 μg/mL unconjugated a2NTD and then with 2 μg/mL a2NTD-AF488. A representative histogram showing competitive inhibition of a2NTD binding to monocytes is reported in (C); the black histogram refers to unstained cells. In (D), the percentages of monocytes and lymphocytes positive for a2NTD binding after competitive assay are shown. Values were normalized to cells that did not receive unlabeled a2NTD. (means ± SEM, n = 4). (E) PBMCs were incubated with a2NTD-AF488 for indicated time at 4°C and 37°C. Some of the samples were then treated with 0.1% trypsin-EDTA (dashed lines) for 5 min to remove surface bound a2NTD. Cell populations were analyzed by flow cytometry, upon gating on CD14+ events. (means ± SEM, n = 8). The percentage of positive monocytes (black lines) or lymphocytes (gray lines) after a2NTD-AF488 incubation is reported.
None
Figure 2. Temperature-dependent binding and internalization of a2NTD by monocytes. (A–D) Peripheral blood mononuclear cells (PBMCs) were pre-incubated at 4°C or 37°C for 30 min, followed by the addition of 10 μg/mL a2NTD conjugated to Alexa Fluor 488 (a2NTD-AF488) for 1 h and staining with an anti-CD14 PE-Texas red antibody for 30 min. Some of the samples were treated with 0.1% trypsin after a2NTD-AF488 incubation to remove surface bound a2NTD. Cells were then placed on slides using a cytospin and imaged using a Nikon fluorescent microscope. Representative images from three independent experiments are shown: PBMCs incubated at 4°C, followed (A) or not (B) by trypsin treatment; PBMC incubated at 37°C, followed (C) or not (D) by trypsin treatment.
None
Figure 3. The internalization of a2NTD requires actin, microtubules and an energy source. (A) Representative histogram showing peripheral blood mononuclear cells (PBMCs) incubated with a control peptide, a2NTD conjugated to Alexa Fluor 488 (a2NTD-AF488) alone, or a2NTD-AF488 after the indicated inhibitors. Cell populations were analyzed by flow cytometry, upon gating on CD14+ event. (B and C) PBMCs were pre-treated with actin and microtubule inhibitors for 1 h followed by the exposure to 10 μg/mL a2NTD-AF488 for 1 h. Representative histograms for each inhibitor are shown in (B). Dashed line depicts cells incubated with a2NTD-AF488 alone, while solid lines refer to cells exposed to inhibitors plus a2NTD. (C) Bar graph values in C illustrate the percentage of a2NTD-positive cells after inhibitor treatment. (means ± SEM, n = 5, **p < 0.001, compared with a2NTD alone). (D) PBMCs were cultured in glucose-free media with or without NaN3 and 2-deoxyglucose (to deplete ATP) or mycophenolic acid (to deplete GTP) for 2 h at 37°C, followed by the administration of a2NTD-AF488 for 1 h. Columns report mean fluorescence intensity (MFI) values (means ± SEM, n = 5, *p < 0.05, compared with a2NTD alone).
None
Figure 4. Binding of a2NTD and intracellular cytokine production in monocyte subpopulations. (A–D) Peripheral blood mononuclear cells (PBMCs) were incubated with 10 μg/mL a2NTD conjugated to Alexa Fluor 488 (a2NTD-AF488) for 1 h and then surface stained with anti-CD14-Pacific Blue and anti-CD16-PE antibodies. (A) Percentage of monocyte populations positive for a2NTD-AF488. (means ± SEM, n = 10, # p < 0.005, CD142+CD16+ vs. CD142+CD16- or CD14+CD16+cells). (B–D) PBMCs were kept in control conditions or stimulated with 10 ng/mL a2NTD for 18 h and sequentially stained for surface expression of CD14/CD16 and the intracellular expression of interleukin(IL)-1α: (B), IL-1β (C) and tumor necrosis factor α (TNFα). (D) The bar graph reports the percentage of a2NTD-positive cells. (means ± SEM, n = 5,, *p < 0.05, ** p < 0.001, compared with unstimulated cells of the same subpopulation).
None
Figure 5. Inhibition of a2NTD endocytosis via trafficking inhibitors. (A–C) Peripheral blood mononuclear cells (PBMCs) were pre-incubated with the indicated trafficking inhibitors for 1 h at 37°C followed by the administration of 10 μg/mL a2NTD conjugated to Alexa Fluor 488 (a2NTD-AF488) for 1 additional h. Cell populations were analyzed by flow cytometry, upon gating on CD14+ events. Representative histograms for each trafficking inhibitor are reported. Dashed lines refer to cells incubated with a2NTD-AF488 alone, while solid lines depict cells incubated with trafficking inhibitor plus a2NTD. Bar graphs depict a2NTD-positive cells for clathrin-mediated endocytosis inhibitors (A), caveolin-mediated endocytosis inhibitors (B) and macropinocytosis inhibitors (C) (means ± SEM, n = 8, #p < 0.001, compared with a2NTD alone). (D) PBMCs were preincubated at 4°C or 37°C with 50 μg/mL 10 kDa dextran conjugated to Alexa Fluor 647 for 30 min. Some of the samples also received dimethylamiloride (DMA) for 30 min. Unconjugated a2NTD was then added (1–100 ng/mL) for 1 h at 37°C. followed by flow cytometry for the quantification of dextran-associated fluorescence. Columns report mean fluorescence intensity (MFI) values (means ± SE M, n = 4, *p < 0.01, ***p < 0.001, compared with cells maintained at 37°C, **p < 0.001, compared with cells receiving the same amount of a2NTD without DMA).
None
Figure 6. Inhibition of a2NTD endocytosis by scavenger receptor inhibitors. (A and B) Peripheral blood mononuclear cells (PBMCs) were pre-incubated with the indicated inhibitors for 1 h at 37°C followed by incubation with 10 μg/mL a2NTD conjugated to Alexa Fluor 488 (a2NTD-AF488) for 1 h. Cell populations were analyzed by flow cytometry, upon gating on CD14+ events. Representative histograms for each inhibitor or negative control are shown. Dashed lines refer to a2NTD-AF488 alone, solid lines to scavenger receptor inhibitors or negative controls plus a2NTD. Columns depict the percentage of a2NTD-positive cells. (means ± SEM, n = 8, *p < 0.001, compared with a2NTD alone). (B) PBMCs were pre-incubated with indicated trafficking inhibitors for 1 h followed by incubation with unconjugated a2NTD for 18 h. Cells were then stained for surface CD14 and then for intracellular interleukin (IL)-1β. Cell populations were analyzed by flow cytometry, upon gating on CD14+ events. Columns depict the percentage of a2NTD-positive cells (means ± SEM, n = 5).

Similar articles

Cited by

References

    1. Sennoune SR, Luo D, Martínez-Zaguilán R. Plasmalemmal vacuolar-type H+-ATPase in cancer biology. Cell Biochem Biophys. 2004;40:185–206. doi: 10.1385/CBB:40:2:185. - DOI - PubMed
    1. Martinez-Zaguilan R, Lynch RM, Martinez GM, Gillies RJ. Vacuolar-type H(+)-ATPases are functionally expressed in plasma membranes of human tumor cells. Am J Physiol. 1993;265:C1015–29. - PubMed
    1. Kubota S, Seyama Y. Overexpression of vacuolar ATPase 16-kDa subunit in 10T1/2 fibroblasts enhances invasion with concomitant induction of matrix metalloproteinase-2. Biochem Biophys Res Commun. 2000;278:390–4. doi: 10.1006/bbrc.2000.3802. - DOI - PubMed
    1. Rofstad EK, Mathiesen B, Kindem K, Galappathi K. Acidic extracellular pH promotes experimental metastasis of human melanoma cells in athymic nude mice. Cancer Res. 2006;66:6699–707. doi: 10.1158/0008-5472.CAN-06-0983. - DOI - PubMed
    1. Sennoune SR, Bakunts K, Martínez GM, Chua-Tuan JL, Kebir Y, Attaya MN, et al. Vacuolar H+-ATPase in human breast cancer cells with distinct metastatic potential: distribution and functional activity. Am J Physiol Cell Physiol. 2004;286:C1443–52. doi: 10.1152/ajpcell.00407.2003. - DOI - PubMed

LinkOut - more resources