Modulation of EEG functional connectivity networks in subjects undergoing repetitive transcranial magnetic stimulation
- PMID: 23471637
- PMCID: PMC4026010
- DOI: 10.1007/s10548-013-0277-y
Modulation of EEG functional connectivity networks in subjects undergoing repetitive transcranial magnetic stimulation
Abstract
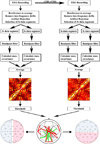
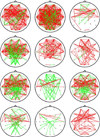
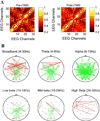
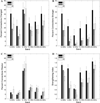
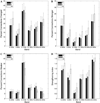
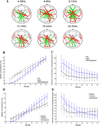
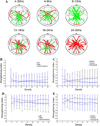
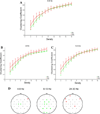
Transcranial magnetic stimulation (TMS) is a noninvasive brain stimulation technique that utilizes magnetic fluxes to alter cortical activity. Continuous theta-burst repetitive TMS (cTBS) results in long-lasting decreases in indices of cortical excitability, and alterations in performance of behavioral tasks. We investigated the effects of cTBS on cortical function via functional connectivity and graph theoretical analysis of EEG data. Thirty-one channel resting-state EEG recordings were obtained before and after 40 s of cTBS stimulation to the left primary motor cortex. Functional connectivity between nodes was assessed in multiple frequency bands using lagged max-covariance, and subsequently thresholded to construct undirected graphs. After cTBS, we find widespread decreases in functional connectivity in the alpha band. There are also simultaneous increases in functional connectivity in the high-beta bands, especially amongst anterior and interhemispheric connections. The analysis of the undirected graphs reveals that interhemispheric and interregional connections are more likely to be modulated after cTBS than local connections. There is also a shift in the topology of network connectivity, with an increase in the clustering coefficient after cTBS in the beta bands, and a decrease in clustering and increase in path length in the alpha band, with the alpha-band connectivity primarily decreased near the site of stimulation. cTBS produces widespread alterations in cortical functional connectivity, with resulting shifts in cortical network topology.
Figures
Similar articles
-
Effects of continuous theta burst stimulation on contralateral primary motor cortex: a concurrent TMS-EEG study.J Neurophysiol. 2024 Nov 1;132(5):1530-1540. doi: 10.1152/jn.00320.2024. Epub 2024 Oct 23. J Neurophysiol. 2024. PMID: 39441211 Clinical Trial.
-
Continuous theta burst transcranial magnetic stimulation affects brain functional connectivity.Annu Int Conf IEEE Eng Med Biol Soc. 2016 Aug;2016:375-378. doi: 10.1109/EMBC.2016.7590718. Annu Int Conf IEEE Eng Med Biol Soc. 2016. PMID: 28268353
-
Shifts in connectivity during procedural learning after motor cortex stimulation: A combined transcranial magnetic stimulation/functional magnetic resonance imaging study.Cortex. 2016 Jan;74:134-48. doi: 10.1016/j.cortex.2015.10.004. Epub 2015 Oct 23. Cortex. 2016. PMID: 26673946 Free PMC article.
-
Measuring Brain Stimulation Induced Changes in Cortical Properties Using TMS-EEG.Brain Stimul. 2015 Nov-Dec;8(6):1010-20. doi: 10.1016/j.brs.2015.07.029. Epub 2015 Jul 17. Brain Stimul. 2015. PMID: 26275346 Review.
-
TMS and TMS-EEG techniques in the study of the excitability, connectivity, and plasticity of the human motor cortex.Rev Neurosci. 2013;24(4):431-42. doi: 10.1515/revneuro-2013-0019. Rev Neurosci. 2013. PMID: 23907420 Review.
Cited by
-
EEG Functional Connectivity is a Weak Predictor of Causal Brain Interactions.Brain Topogr. 2020 Mar;33(2):221-237. doi: 10.1007/s10548-020-00757-6. Epub 2020 Feb 24. Brain Topogr. 2020. PMID: 32090281 Free PMC article.
-
Hypothesis-driven methods to augment human cognition by optimizing cortical oscillations.Front Syst Neurosci. 2014 Jun 26;8:119. doi: 10.3389/fnsys.2014.00119. eCollection 2014. Front Syst Neurosci. 2014. PMID: 25018706 Free PMC article. Review.
-
Changes in Global and Nodal Networks in Patients With Unipolar Depression After 3-Week Repeated Transcranial Magnetic Stimulation Treatment.Front Psychiatry. 2019 Oct 9;10:686. doi: 10.3389/fpsyt.2019.00686. eCollection 2019. Front Psychiatry. 2019. PMID: 31649561 Free PMC article.
-
The Illusion of the Perfect Brain Enhancer.Cerebrum. 2017 Sep 1;2017:cer-11-17. eCollection 2017 Sep-Oct. Cerebrum. 2017. PMID: 30210662 Free PMC article.
-
Characterizing Brain Connectivity From Human Electrocorticography Recordings With Unobserved Inputs During Epileptic Seizures.Neural Comput. 2019 Jul;31(7):1271-1326. doi: 10.1162/neco_a_01205. Epub 2019 May 21. Neural Comput. 2019. PMID: 31113298 Free PMC article.
References
-
- Barker AT, Jalinous R, Freeston IL. Non-invasive magnetic stimulation of human motor cortex. Lancet. 1985;1:1106–1107. - PubMed
-
- Bestmann S, Baudewig J, Siebner HR, Rothwell JC, Frahm J. Subthreshold high-frequency TMS of human primary motor cortex modulates interconnected frontal motor areas as detected by interleaved fMRI-TMS. Neuroimage. 2003;20:1685–1696. - PubMed
-
- Bestmann S, Baudewig J, Siebner HR, Rothwell JC, Frahm J. Functional MRI of the immediate impact of transcranial magnetic stimulation on cortical and subcortical motor circuits. Eur J Neurosci. 2004;19:1950–1962. - PubMed
Publication types
MeSH terms
Grants and funding
LinkOut - more resources
Full Text Sources
Other Literature Sources
Miscellaneous

