Identification of shared genes and pathways: a comparative study of multiple sclerosis susceptibility, severity and response to interferon beta treatment
- PMID: 23469041
- PMCID: PMC3585216
- DOI: 10.1371/journal.pone.0057655
Identification of shared genes and pathways: a comparative study of multiple sclerosis susceptibility, severity and response to interferon beta treatment
Abstract
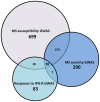
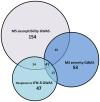
Recent genome-wide association studies (GWAS) have successfully identified several gene loci associated with multiple sclerosis (MS) susceptibility, severity or interferon-beta (IFN-ß) response. However, due to the nature of these studies, the functional relevance of these loci is not yet fully understood. We have utilized a systems biology based approach to explore the genetic interactomes of these MS related traits. We hypothesised that genes and pathways associated with the 3 MS related phenotypes might interact collectively to influence the heterogeneity and unpredictable clinical outcomes observed. Individual genetic interactomes for each trait were constructed and compared, followed by prioritization of common interactors based on their frequencies. Pathway enrichment analyses were performed to highlight shared functional pathways. Biologically relevant genes ABL1, GRB2, INPP5D, KIF1B, PIK3R1, PLCG1, PRKCD, SRC, TUBA1A and TUBA4A were identified as common to all 3 MS phenotypes. We observed that the highest number of first degree interactors were shared between MS susceptibility and MS severity (p = 1.34×10(-79)) with UBC as the most prominent first degree interactor for this phenotype pair from the prioritisation analysis. As expected, pairwise comparisons showed that MS susceptibility and severity interactomes shared the highest number of pathways. Pathways from signalling molecules and interaction, and signal transduction categories were found to be highest shared pathways between 3 phenotypes. Finally, FYN was the most common first degree interactor in the MS drugs-gene network. By applying the systems biology based approach, additional significant information can be extracted from GWAS. Results of our interactome analyses are complementary to what is already known in the literature and also highlight some novel interactions which await further experimental validation. Overall, this study illustrates the potential of using a systems biology based approach in an attempt to unravel the biological significance of gene loci identified in large GWAS.
Conflict of interest statement
Figures


Similar articles
-
The Shared Mechanism and Candidate Drugs of Multiple Sclerosis and Sjögren's Syndrome Analyzed by Bioinformatics Based on GWAS and Transcriptome Data.Front Immunol. 2022 Mar 9;13:857014. doi: 10.3389/fimmu.2022.857014. eCollection 2022. Front Immunol. 2022. PMID: 35356004 Free PMC article.
-
Integrating genome-wide association studies and gene expression data highlights dysregulated multiple sclerosis risk pathways.Mult Scler. 2017 Feb;23(2):205-212. doi: 10.1177/1352458516649038. Epub 2016 Jul 11. Mult Scler. 2017. PMID: 27207450
-
Dense module searching for gene networks associated with multiple sclerosis.BMC Med Genomics. 2020 Apr 3;13(Suppl 5):48. doi: 10.1186/s12920-020-0674-5. BMC Med Genomics. 2020. PMID: 32241259 Free PMC article.
-
Pharmacogenomics of the response to IFN-beta in multiple sclerosis: ramifications from the first genome-wide screen.Pharmacogenomics. 2008 May;9(5):639-45. doi: 10.2217/14622416.9.5.639. Pharmacogenomics. 2008. PMID: 18466107 Review.
-
Genome-wide association studies in multiple sclerosis: lessons and future prospects.Brief Funct Genomics. 2011 Mar;10(2):61-70. doi: 10.1093/bfgp/elr004. Epub 2011 Feb 10. Brief Funct Genomics. 2011. PMID: 21310812 Review.
Cited by
-
Layered signaling regulatory networks analysis of gene expression involved in malignant tumorigenesis of non-resolving ulcerative colitis via integration of cross-study microarray profiles.PLoS One. 2013 Jun 25;8(6):e67142. doi: 10.1371/journal.pone.0067142. Print 2013. PLoS One. 2013. PMID: 23825635 Free PMC article.
-
Efficacy of Vafidemstat in Experimental Autoimmune Encephalomyelitis Highlights the KDM1A/RCOR1/HDAC Epigenetic Axis in Multiple Sclerosis.Pharmaceutics. 2022 Jul 6;14(7):1420. doi: 10.3390/pharmaceutics14071420. Pharmaceutics. 2022. PMID: 35890315 Free PMC article.
-
Dido mutations trigger perinatal death and generate brain abnormalities and behavioral alterations in surviving adult mice.Proc Natl Acad Sci U S A. 2015 Apr 14;112(15):4803-8. doi: 10.1073/pnas.1419300112. Epub 2015 Mar 30. Proc Natl Acad Sci U S A. 2015. PMID: 25825751 Free PMC article.
-
GWAS analysis implicates NF-κB-mediated induction of inflammatory T cells in multiple sclerosis.Genes Immun. 2016 Jul;17(5):305-12. doi: 10.1038/gene.2016.23. Epub 2016 Jun 9. Genes Immun. 2016. PMID: 27278126 Free PMC article.
-
A Survey of Gene Prioritization Tools for Mendelian and Complex Human Diseases.J Integr Bioinform. 2019 Sep 9;16(4):20180069. doi: 10.1515/jib-2018-0069. J Integr Bioinform. 2019. PMID: 31494632 Free PMC article. Review.
References
-
- International Multiple Sclerosis Genetics Consortium, Hafler DA, Compston A, Sawcer S, Lander ES, et al. (2007) Risk alleles for multiple sclerosis identified by a genomewide study. N Engl J Med 357: 851–862. - PubMed
-
- Aulchenko YS, Hoppenbrouwers IA, Ramagopalan SV, Broer L, Jafari N, et al. (2008) Genetic variation in the KIF1B locus influences susceptibility to multiple sclerosis. Nat Genet 40: 1402–1403. - PubMed
Publication types
MeSH terms
Substances
Grants and funding
LinkOut - more resources
Full Text Sources
Other Literature Sources
Medical
Research Materials
Miscellaneous

