. 2013 Feb;9(2):e1003198.
doi: 10.1371/journal.ppat.1003198. Epub 2013 Feb 28.

Super-resolution microscopy reveals specific recruitment of HIV-1 envelope proteins to viral assembly sites dependent on the envelope C-terminal tail

Affiliations

Super-resolution microscopy reveals specific recruitment of HIV-1 envelope proteins to viral assembly sites dependent on the envelope C-terminal tail

Walter Muranyi et al. PLoS Pathog. 2013 Feb.

Abstract

The inner structural Gag proteins and the envelope (Env) glycoproteins of human immunodeficiency virus (HIV-1) traffic independently to the plasma membrane, where they assemble the nascent virion. HIV-1 carries a relatively low number of glycoproteins in its membrane, and the mechanism of Env recruitment and virus incorporation is incompletely understood. We employed dual-color super-resolution microscopy visualizing Gag assembly sites and HIV-1 Env proteins in virus-producing and in Env expressing cells. Distinctive HIV-1 Gag assembly sites were readily detected and were associated with Env clusters that always extended beyond the actual Gag assembly site and often showed enrichment at the periphery and surrounding the assembly site. Formation of these Env clusters depended on the presence of other HIV-1 proteins and on the long cytoplasmic tail (CT) of Env. CT deletion, a matrix mutation affecting Env incorporation or Env expression in the absence of other HIV-1 proteins led to much smaller Env clusters, which were not enriched at viral assembly sites. These results show that Env is recruited to HIV-1 assembly sites in a CT-dependent manner, while Env(ΔCT) appears to be randomly incorporated. The observed Env accumulation surrounding Gag assemblies, with a lower density on the actual bud, could facilitate viral spread in vivo. Keeping Env molecules on the nascent virus low may be important for escape from the humoral immune response, while cell-cell contacts mediated by surrounding Env molecules could promote HIV-1 transmission through the virological synapse.


Conflict of interest statement

The authors have declared that no competing interests exist.

Figures
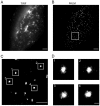
Figure 1
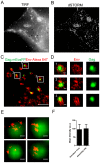
Figure 1. Distribution of Gag.mEosFP at the plasma membrane of HeLa cells imaged by super-resolution TIRF microscopy.
HeLa cells were transfected with equimolar amounts of pCHIV and pCHIVmEosFP. At 24 hpt, cells were fixed and HIV-1 assembly sites were imaged by PALM as described in Materials and Methods. Summed intensity TIRF (A) and high resolution PALM (B) microscopy images of a representative cell are displayed. Scale bars correspond to 2 µm. The boxed region in (B) corresponds to the region of interest shown as an enlarged high resolution image in (C). Scale bar in (C) corresponds to 1 µm. (D) Four individual HIV-1 assembly sites from the boxed regions shown in (C). Scale bar corresponds to 100 nm.
Figure 2
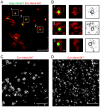
Figure 2. Distribution of HIV-1 Env at the plasma membrane of HeLa cells visualized by super-resolution TIRF microscopy.
HeLa cells were transfected with equimolar amounts of pCHIV and pCHIVmEosFP. Cells were fixed 24 hpt, stained by indirect immunofluorescence using MAb 2G12 and goat anti-human Alexa Fluor 647 and imaged by dSTORM as described in Materials and Methods. Summed intensity TIRF (A) and high resolution dSTORM (B) microscopy images of a representative cell are displayed. Scale bars correspond to 2 µm. (C) Region from the plasma membrane of a representative cell, showing the superposition of a PALM image for Gag.mEosFP (green) and the corresponding dSTORM image of Env stained with Alexa Fluor 647 (red), respectively. HeLa cells transfected with equimolar amounts of pCHIV and pCHIVmEosFP were fixed and stained by indirect immunofluorescence using MAb 2G12 and goat anti-human Alexa Fluor 647. Cells were subjected to dual-color super-resolution microscopy as described in Materials and Methods. Scale bar corresponds to 1 µm. (D) Individual HIV-1 assembly sites from the boxed regions are shown. Scale bar corresponds to 100 nm. (E) Env surface distribution on extracellular immature HIV-1 particles. Particles were purified from the supernatant of 293T cells transfected with pCHIV carrying a point mutation in the HIV-1 protease active site . An eGFP-tagged version of the accessory protein Vpr was included as a marker to localize the position of individual virions in diffraction limited images. Virions were adhered to fibronectin-coated coverslips, fixed and immunostained with MAb 2G12 and goat anti-human Alexa Fluor 647. The panel shows images of four individual particles with the eGFP signal (green) recorded in diffraction limited mode and the Alexa Fluor 647 (red) signal recorded by dSTORM. Scale bars correspond to 100 nm. (F) Comparison of the Env signal intensities on single extracellular immature particles with the Env signal intensities colocalizing with HIV-1 assembly sites defined by the dSTORM signal for Gag.mEosFP. Fluorescence intensities of the Alexa Fluor 647 signals were determined for the super-resolution images of ten individual particles each. The histogram shows the average values and SD of the fluorescence intensity.
Figure 3
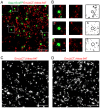
Figure 3. Comparative analysis of Env(wt) distribution expressed in the viral context or alone.
(A, B) Distribution of HIV-1 Gag and Env at the plasma membrane of HeLa cells transfected with equimolar amounts of pCHIV and pCHIVmEosFP. Unfixed cells were stained by indirect immunofluorescence using Fab 2G12 and Fab goat anti-human Alexa Fluor 647, fixed, and subjected to dual-color super-resolution microscopy as described in Materials and Methods. (A) Region from the plasma membrane of a representative cell, showing the superposition of a PALM image for Gag.mEosFP (green) and the corresponding dSTORM image of Env stained with Alexa Fluor 647 (red), respectively. Scale bar corresponds to 1 µm. (B) Enlargement of three individual assembly sites from the boxed regions indicated in (A). The figure shows merged super-resolution images (left panels), the dSTORM Env Alexa Fluor 647 image (middle panels) and individual Alexa Fluor 647 localizations from all images recorded in the defined area as black dots, with a black circle representing the rims of the Gag cluster (right panels), respectively. Scale bar corresponds to 100 nm. (C, D) Env distribution patterns in the presence (C) and absence (D) of other HIV-1 derived proteins. HeLa cells were transfected with equimolar amounts of pCHIV and pCHIVmEosFP (C) or with pEnv(wt) (D), respectively. Unfixed cells were stained with 2G12 Fab and Alexa Fluor 647 Fab, fixed, and visualized by dual-color super-resolution microscopy as described in Materials and Methods. Scale bars represent 1 µm.
Figure 4
Figure 4. Comparative analysis of Env(ΔCT) distribution expressed in the viral context or alone.
(A, B) Distribution of HIV-1 Gag and Env at the plasma membrane of HeLa cells transfected with equimolar amounts of pCHIV.Env(ΔCT) and pCHIVmEosFP. Env(ΔCT). Unfixed cells were stained by indirect immunofluorescence using Fab 2G12 and Fab goat anti-human Alexa Fluor 647, fixed, and subjected to dual-color super-resolution microscopy as described in Materials and Methods. (A) Region from the plasma membrane of a representative cell, showing the superposition of a PALM image for Gag.mEosFP (green) and the corresponding dSTORM image of Env(ΔCT) stained with Alexa Fluor 647 (red), respectively. Scale bar corresponds to 1 µm. (B) Enlargement of three individual assembly sites from the boxed regions indicated in (A). The figure shows merged super-resolution images (left panels), the dSTORM Env Alexa Fluor 647 image (middle panels) and individual Alexa Fluor 647 localizations from all images recorded in the defined area as black dots, with a black circle representing the rims of the Gag cluster (right panels), respectively. Scale bar corresponds to 100 nm. (C, D) Comparison of Env(ΔCT) distribution patterns in the presence (C) and absence (D) of other HIV-1 derived proteins. HeLa cells were transfected with equimolar amounts of pCHIV.Env(ΔCT) and pCHIVmEosFPEnv(ΔCT) (C) or with pEnv(ΔCT) (D), respectively. Unfixed cells were stained with 2G12 Fab and Alexa Fluor 647 Fab, fixed, and visualized by dSTORM as described. Scale bars represent 1 µm.
Figure 5
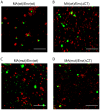
Figure 5. Distribution of Env(wt) or Env(ΔCT) in the context of an Env-interaction deficient Gag variant.
HeLa cells were transfected with proviral constructs carrying both wt Gag and wt Env (A), wt Gag and Env(ΔCT) (B), Gag carrying the MA mutation and wt Env (C), or comprising both mutated MA and Env(ΔCT) (D), respectively. Fixed cells were stained by indirect immunofluorescence using MAb APR342 and goat anti-mouse Alexa Fluor 532 and MAb 2G12 and goat anti-human Alexa Fluor 647, and subjected to dual-color dSTORM. Scale bar corresponds to 1 µm. An overview of respective cells is presented in Figure S7.
Figure 6
Figure 6. Computational cluster analysis of HIV-1 Env membrane distribution.
Global cluster analysis of Env distribution at the plasma membrane was performed based on super-resolution images of HeLa cells transfected with pCHIV/pCHIVmEos.FP, pCHIV. Env(ΔCT)/pCHIVmEosFPEnv(ΔCT), pEnv(wt) or pEnv(ΔCT), or of A3.01 T-cells nucleofected with pCHIV/pCHIVmEos.FP or pCHIV.Env(ΔCT)/pCHIVmEosFPEnv(ΔCT), respectively. (A) Image-based, morphological cluster analysis of entire cells. (B) Differential distribution of cluster size for Env(wt) on the surface of HeLa cells in the presence and absence of other viral proteins. The curve was derived by subtraction of the normalized distribution of cluster size obtained by image-based cluster analysis for Env(wt) expressed in the HIV-1 context from that obtained upon expression of Env(wt) alone. (C) Coordinate based all-distance distribution analysis by Ripley's H-function. Statistical evaluation of the maximal H-values [nm] was performed as a correlate of the average cluster diameter. (D) Statistical evaluation of the amplitude of the H-function [a.u.] as a measure of the average degree of clustering. Box plots display 5th percentile, 25th percentile, median (straight line), mean (square), 75th percentile and 95th percentile.
Figure 7
Figure 7. Averaged super-resolution intensity distribution of Env at HIV-1 assembly sites.
Image-based, averaged assembly site analysis performed on super-imposed high-resolution images of individual Gag.mEosFP clusters (green) from cells transfected with pCHIV/pCHIVmEosFP (A) or pCHIV.Env(ΔCT)/pCHIVmEosFPEnv(ΔCT) (B), respectively (n = 7 assembly sites per condition) and the averaged Env Alexa Fluor 647 signal in the respective area (red). Graphs show the profile of intensity through the center of the averaged, overlaid intensity images: green line, Gag.mEosFP; red line, Env. Scale bars represent 50 nm.

Similar articles

Cited by

References

    1. Sundquist WI, Krausslich HG (2012) HIV-1 Assembly, Budding, and Maturation. Cold Spring Harb Perspect Med 2: a006924. - PMC - PubMed
    1. Checkley MA, Luttge BG, Freed EO (2011) HIV-1 envelope glycoprotein biosynthesis, trafficking, and incorporation. J Mol Biol 410: 582–608. - PMC - PubMed
    1. Chertova E, Bess JW Jr, Crise BJ, Sowder IR, Schaden TM, et al. (2002) Envelope glycoprotein incorporation, not shedding of surface envelope glycoprotein (gp120/SU), Is the primary determinant of SU content of purified human immunodeficiency virus type 1 and simian immunodeficiency virus. J Virol 76: 5315–5325. - PMC - PubMed
    1. Zhu P, Chertova E, Bess J Jr, Lifson JD, Arthur LO, et al. (2003) Electron tomography analysis of envelope glycoprotein trimers on HIV and simian immunodeficiency virus virions. Proc Natl Acad Sci U S A 100: 15812–15817. - PMC - PubMed
    1. Dorfman T, Mammano F, Haseltine WA, Gottlinger HG (1994) Role of the matrix protein in the virion association of the human immunodeficiency virus type 1 envelope glycoprotein. J Virol 68: 1689–1696. - PMC - PubMed

Publication types

Substances

Grants and funding

This work was supported by the Systems Biology Initiative (FORSYS) of the German Ministry of Research and Education (BMBF), project VIROQUANT and grant number 0315262. The funders had no role in study design, data collection and analysis, decision to publish, or preparation of the manuscript.

LinkOut - more resources