

PACAP signaling exerts opposing effects on neuroprotection and neuroinflammation during disease progression in the SOD1(G93A) mouse model of amyotrophic lateral sclerosis
- PMID: 23466699
- PMCID: PMC3955759
- DOI: 10.1016/j.nbd.2013.02.010
PACAP signaling exerts opposing effects on neuroprotection and neuroinflammation during disease progression in the SOD1(G93A) mouse model of amyotrophic lateral sclerosis
Abstract
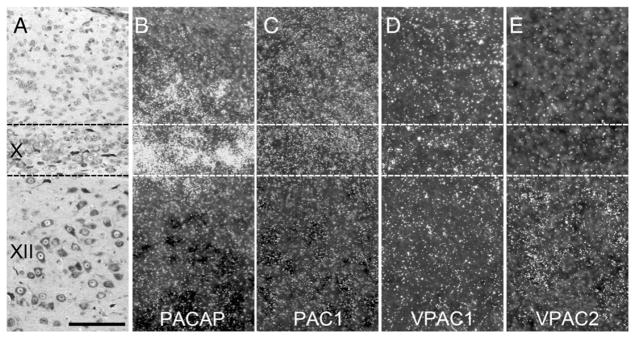
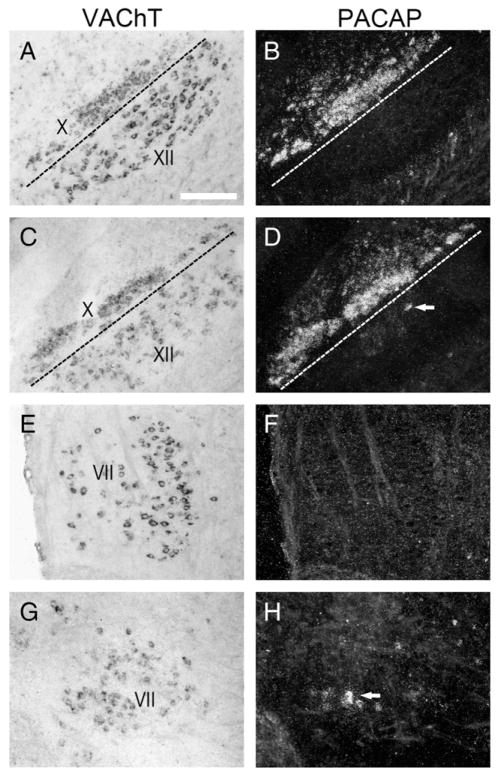
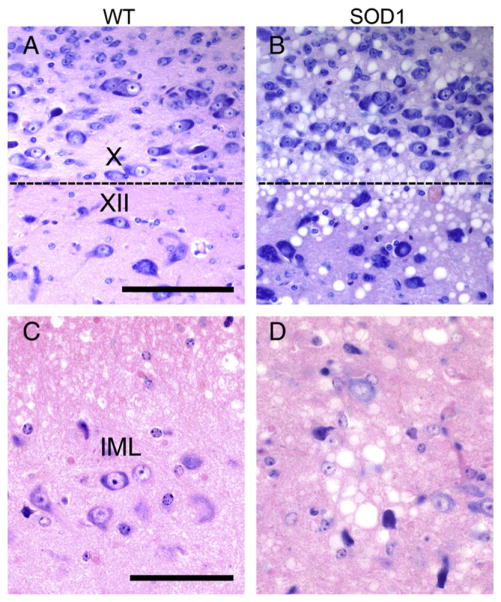
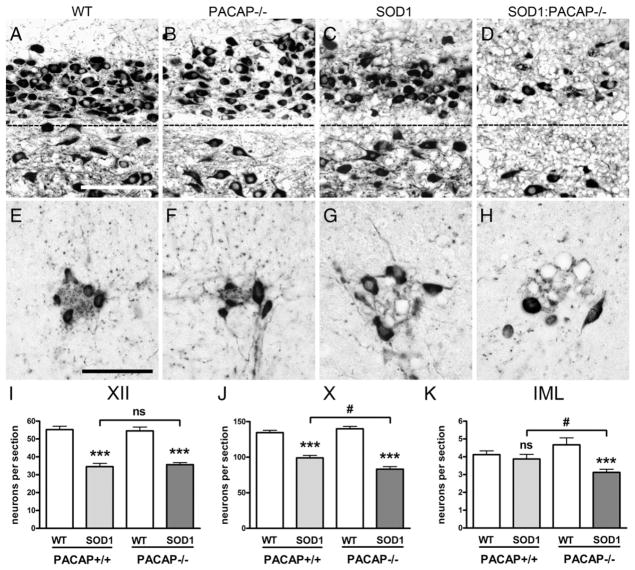
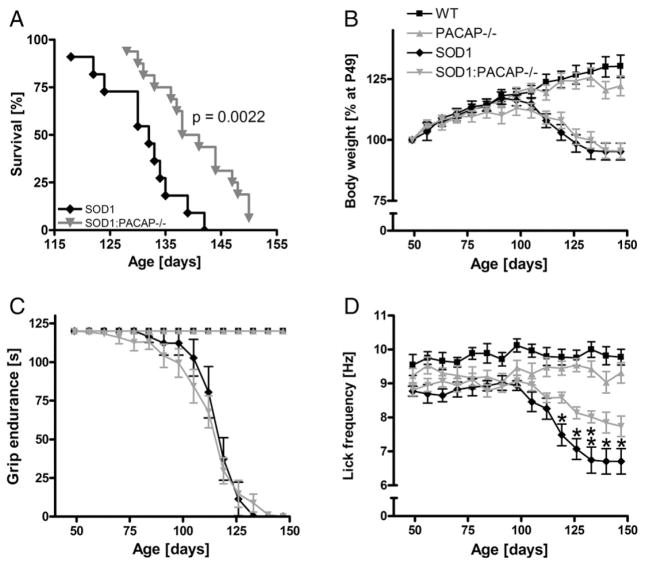
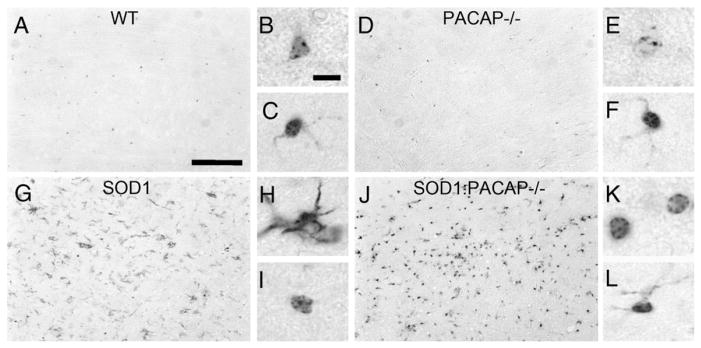
Pituitary adenylate cyclase-activating polypeptide (PACAP) is a pleiotropic peptide with autocrine neuroprotective and paracrine anti-inflammatory properties in various models of acute neuronal damage and neurodegenerative diseases. Therefore, we examined a possible beneficial role of endogenous PACAP in the superoxide dismutase 1, SOD1(G93A), mouse model of amyotrophic lateral sclerosis (ALS), a lethal neurodegenerative disease particularly affecting somatomotor neurons. In wild-type mice, somatomotor and visceromotor neurons in brain stem and spinal cord were found to express the PACAP specific receptor PAC1, but only visceromotor neurons expressed PACAP as a potential autocrine source of regulation of these receptors. In SOD1(G93A) mice, only a small subset of the surviving somatomotor neurons showed induction of PACAP mRNA, and somatomotor neuron degeneration was unchanged in PACAP-deficient SOD1(G93A) mice. Pre-ganglionic sympathetic visceromotor neurons were found to be resistant in SOD1(G93A) mice, while pre-ganglionic parasympathetic neurons degenerated during ALS disease progression in this mouse model. PACAP-deficient SOD1(G93A) mice showed even greater pre-ganglionic parasympathetic neuron loss compared to SOD1(G93A) mice, and additional degeneration of pre-ganglionic sympathetic neurons. Thus, constitutive expression of PACAP and PAC1 may confer neuroprotection to central visceromotor neurons in SOD1(G93A) mice via autocrine pathways. Regarding the progression of neuroinflammation, the switch from amoeboid to hypertrophic microglial phenotype observed in SOD1(G93A) mice was absent in PACAP-deficient SOD1(G93A) mice. Thus, endogenous PACAP may promote microglial cytodestructive functions thought to drive ALS disease progression. This hypothesis was consistent with prolongation of life expectancy and preserved tongue motor function in PACAP-deficient SOD1(G93A) mice, compared to SOD1(G93A) mice. Given the protective role of PACAP expression in visceromotor neurons and the opposing effect on microglial function in SOD1(G93A) mice, both PACAP agonism and antagonism may be promising therapeutic tools for ALS treatment, if stage of disease progression and targeting the specific auto- and paracrine signaling pathways are carefully considered.
Copyright © 2013 Elsevier Inc. All rights reserved.
Figures
Similar articles
-
Neuroprotective effect of the PACAP-ADNP axis on SOD1G93A mutant motor neuron death induced by trophic factors deprivation.Neuropeptides. 2023 Dec;102:102386. doi: 10.1016/j.npep.2023.102386. Epub 2023 Oct 11. Neuropeptides. 2023. PMID: 37856900
-
Microglia and motor neurons during disease progression in the SOD1G93A mouse model of amyotrophic lateral sclerosis: changes in arginase1 and inducible nitric oxide synthase.J Neuroinflammation. 2014 Mar 23;11:55. doi: 10.1186/1742-2094-11-55. J Neuroinflammation. 2014. PMID: 24655927 Free PMC article.
-
Transcriptomic indices of fast and slow disease progression in two mouse models of amyotrophic lateral sclerosis.Brain. 2013 Nov;136(Pt 11):3305-32. doi: 10.1093/brain/awt250. Epub 2013 Sep 24. Brain. 2013. PMID: 24065725
-
Altered expression of atypical PKC and Ryk in the spinal cord of a mouse model of amyotrophic lateral sclerosis.Dev Neurobiol. 2014 Aug;74(8):839-50. doi: 10.1002/dneu.22137. Epub 2014 Jan 22. Dev Neurobiol. 2014. PMID: 24123880 Free PMC article. Review.
-
Could Sirtuin Activities Modify ALS Onset and Progression?Cell Mol Neurobiol. 2017 Oct;37(7):1147-1160. doi: 10.1007/s10571-016-0452-2. Epub 2016 Dec 10. Cell Mol Neurobiol. 2017. PMID: 27942908 Review.
Cited by
-
Motor Neuron Diseases and Neuroprotective Peptides: A Closer Look to Neurons.Front Aging Neurosci. 2021 Sep 17;13:723871. doi: 10.3389/fnagi.2021.723871. eCollection 2021. Front Aging Neurosci. 2021. PMID: 34603008 Free PMC article. Review.
-
Disruption of calcitonin gene-related peptide signaling accelerates muscle denervation and dampens cytotoxic neuroinflammation in SOD1 mutant mice.Cell Mol Life Sci. 2017 Jan;74(2):339-358. doi: 10.1007/s00018-016-2337-4. Epub 2016 Aug 23. Cell Mol Life Sci. 2017. PMID: 27554772 Free PMC article.
-
Retinal Ganglion Cell Loss and Microglial Activation in a SOD1G93A Mouse Model of Amyotrophic Lateral Sclerosis.Int J Mol Sci. 2021 Feb 7;22(4):1663. doi: 10.3390/ijms22041663. Int J Mol Sci. 2021. PMID: 33562231 Free PMC article.
-
Exploration of attractor modules for sporadic amyotrophic lateral sclerosis via systemic module inference and attract method.Exp Ther Med. 2019 Apr;17(4):2575-2580. doi: 10.3892/etm.2019.7264. Epub 2019 Feb 13. Exp Ther Med. 2019. PMID: 30906448 Free PMC article.
-
PACAP Modulates the Autophagy Process in an In Vitro Model of Amyotrophic Lateral Sclerosis.Int J Mol Sci. 2020 Apr 22;21(8):2943. doi: 10.3390/ijms21082943. Int J Mol Sci. 2020. PMID: 32331311 Free PMC article.
References
-
- Arimura A, Somogyvári-Vigh A, Miyata A, Mizuno K, Coy DH, Kitada C. Tissue distribution of PACAP as determined by RIA: highly abundant in the rat brain and testes. Endocrinology. 1991;129:2787–2789. - PubMed
-
- Armstrong BD, Hu Z, Abad C, Yamamoto M, Rodriguez WI, Cheng J, Tam J, Gomariz RP, Patterson PH, Waschek JA. Lymphocyte regulation of neuropeptide gene expression after neuronal injury. J Neurosci Res. 2003;74:240–247. - PubMed
MeSH terms
Substances
Grants and funding
LinkOut - more resources
Full Text Sources
Other Literature Sources
Medical
Molecular Biology Databases
Miscellaneous
