. 2013:4:1553.
doi: 10.1038/ncomms2535.

COG complexes form spatial landmarks for distinct SNARE complexes

Affiliations

COG complexes form spatial landmarks for distinct SNARE complexes

Rose Willett et al. Nat Commun. 2013.

Abstract

Vesicular tethers and SNAREs (soluble N-ethylmalemide-sensitive fusion attachment protein receptors) are two key protein components of the intracellular membrane-trafficking machinery. The conserved oligomeric Golgi (COG) complex has been implicated in the tethering of retrograde intra-Golgi vesicles. Here, using yeast two-hybrid and co-immunoprecipitation approaches, we show that three COG subunits, namely COG4, 6 and 8, are capable of interacting with defined Golgi SNAREs, namely STX5, STX6, STX16, GS27 and SNAP29. Comparative analysis of COG8-STX16 and COG4-STX5 interactions by a COG-based mitochondrial relocalization assay reveals that the COG8 and COG4 proteins initiate the formation of two different tethering platforms that can facilitate the redirection of two populations of Golgi transport intermediates to the mitochondrial vicinity. Our results uncover a role for COG sub-complexes in defining the specificity of vesicular sorting within the Golgi.


Conflict of interest statement

Conflict of interest statement

None declared.

Figures

Figure 1
Figure 1. COG8 C terminus interacts with SNARE domain of STX16
HeLa cells transiently co-transfected with plasmids encoding fluorescent tagged SNAREs and COG-myc constructs as indicated (a). 24 h post-transfection, cells were collected, lysed, and GFP-SNARE interacting proteins were precipitated with anti-GFP antibodies. Immuno-precipitates, along with 10% of total input, were separated on a 12% SDS-PAGE gel, transferred to nitrocellulose membrane, and probed with antibodies against myc (b, upper panel) and GFP (b, lower panel). COG8Δ8–184-myc and COG8Δ8–436-myc are still capable of interaction with full length GFP-STX16. GFP-STX16 truncated mutants missing either the N terminus (GFP-STX16 Δ2–73) or N terminus and Habc domain (GFP-STX16 Δ2–169) are both still capable of interaction with full length COG8-myc.
Figure 2
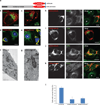
Figure 2. Mitochondrial clustering and Golgi fragmentation in cells expressing COG subunits on mitochondria
A schematic diagram of the mitochondrial targeting protein constructs (a). HeLa cells expressing mChActA (b, f), COG8-mChActA (c, d), or COG4-mChActA (e, g) were analyzed 24 h after transfection using confocal or TEM microscopy. Cells were stained with antibodies to Giantin (b, c) to identify Golgi, or mitochondria resident protein Ox Phos ComplexV (d, e) to image mitochondria. Mitochondria are not clustered in untransfected cells (d, e, asterisk), or in cells expressing mChActA (b, f), and clustered in cells expressing COG8-mChActA (c, d) or COG4-mChActA (e, g). Using a gene replacement strategy, cells were depleted of COG8 (h, i) or COG4 (j, k) using siRNA transfection. 72 h after knock-down cells were transfected with siRNA resistant COG8-mChActA (h, i) or COG4-mChActA (j, k), 24 h later cells were stained with antibodies to STX16 (h, k) or STX5 (i, j) (asterisk denotes non transfected cell). Endogenous STX16 is partially mislocalized to COG8 labeled mitochondria (h), while endogenous STX5 shows co-localization with COG4-clustered mitochondria (j). Quantification of the Golgi disruption phenotype in cells expressing mitochondria-targeted COG subunits (l). HeLa cells plated on coverslips were transfected with plasmids encoding either mChActA, COG4-mChActA, or COG8-mChActA. 24 hrs after transfection, cells were fixed and stained with antibodies against GM130 and analyzed using confocal microscopy, Size bars; IF-10 µm, TEM 2 µm. Golgi fragmentation was scored by evaluation of Golgi morphology based on GM130 signal in transfected cells. Averages of three independent measurements, mChActA n=66, COG4-mChActA n=44, COG8-mChActA n=38. Error bars denote standard deviation from average.
Figure 3
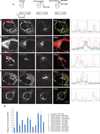
Figure 3. Mitochondria-targeted COG4 relocates STX5 membranes and attracts Lobe A and B COG subunits
A schematic diagram of the mitochondrial targeting protein constructs (a). HeLa cells transiently expressing GFP-STX5 (b), CFP-STX5 (c), GFP-STX16 (d), or stably expressing YFP-COG3 (c, e), or GFP-COG6 (f), were transfected with a plasmid encoding either mChActA (c) or COG4-mChActa (b, d–f). 24 h after transfection cells were fixed, and then stained with antibodies to Giantin or p115 as indicated, and analyzed by confocal microscopy. Line plots for overlap between red, green and blue channels are shown measuring the relative value of signal intensity (y-axis) over the distance measured in pixels (x-axis). Size bar, 10 µm. Plot for the average Pearson coefficient for colocalization between mCherry/red and GFP/green signal for indicated constructs and proteins (g) error bars represent standard deviation, n≥3.
Figure 4
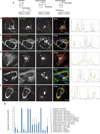
Figure 4. Mitochondria-targeted COG8 relocates STX16 vesicles and attracts obe B COG subunits
A schematic diagram of the mitochondrial targeting protein constructs (a). HeLa cells transiently expressing GFP-STX5 (b), GFP-STX16 (c, d), or stably expressing YFP-COG3 (e), or GFP-COG6 (f), were transfected with a plasmid encoding either mChActA (d) or COG8-mChActa (b, c, e, f). 24 h after transfection cells were fixed, stained with antibodies to Giantin, and analyzed by confocal microscopy. Line plots for overlap between red, green and blue channels are shown measuring the relative value of signal intensity (y-axis) over the distance measured in pixels (x-axis). Size bar, 10 µm. Plot for the average Pearson coefficient for colocalization between mCherry/red and GFP/green signal for the indicated constructs and proteins (g) error bars represent standard deviation, n≥3.
Figure 5
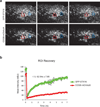
Figure 5. GFP-STX16 containing membranes cycle rapidly on/off COG8-mChActA labeled mitochondria
HeLa cells transiently expressing COG8-mChActA and GFP-STX16 were incubated at 37°C and visualized with a LSM710 laser confocal microscope. Both COG8-mChActA and GFP-STX16 were bleached and their FRAP was measured over a course of 7 minutes. Representative frames for pre-bleached and post-bleached time points are shown (a). FRAP of COG8-mChActA was slower compared to GFP-STX16 which had a t1/2 of 62.54 seconds (b), average from two experiments.
Figure 6
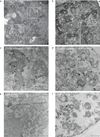
Figure 6. Vesicles associate with mitochondria in cells expressing COG8 or COG4 targeted to mitochondria
Electron micrograph of HeLa (a, b) and Vero (c–f) cells transiently transfected with COG4-mChActa (a), COG8-mChActA (b), COG4-mChActA + GFP-STX5 (c), COG8-mChActA + GFP-STX16 (d), mChActA + GFP-STX5 (e), mChActA + GFP-STX16 (f). 24 h after transfection cells were fixed and processed for TEM (a, b) or immuno-EM (c–f). The inset shows a high magnification view of vesicular profiles. Mitochondria (M) and mitochondria-associated vesicles (see arrows) are indicated. Size bar, 500 nm (inset 100nm).
Figure 7
Figure 7. COG8 is required for localization of STX16 containing trafficking intermediates
HeLa cells were co-transfected with plasmids encoding COG8-mChActa and GFP-STX16 (a), or mChActA and GFP-STX16 (b). 20 h after transfection cells were pulsed with Alexa647 labeled STB (STB647) for 20 min, then washed and additionally chased in fresh media for 2 h. Cells were fixed, and analyzed by confocal microscopy. HeLa cells were transfected with GFP-STX16 (c), or co-transfected with GFP-STX16 and COG8 siRNA (d) by electroporation. After 72 h cells were fixed, stained with COG8 and GM130 antibodies, and analyzed using confocal microscopy. White arrows indicate change in localization of GFP-STX16 from GM130 labeled Golgi membranes to the plasma membrane. Quantitative analysis (e) performed as follows; Control n=24, COG8 KD n=31, error bars represent standard deviation. STX16 fluorescence was measured using ImageJ software and measuring GFP-STX16 signal in GM130 labeled Golgi ROI and around the total cell. Students t-test was used to calculate p value. * p=4.86E-18. Size bar, 10 µm.
Figure 8
Figure 8. COG complex serves as a spatial landmark for precise localization of Qa SNAREs in Golgi subdomains
Hypothetical model of how the COG complex functions in organizing different SNARE complexes on Golgi membranes. The recycling STX5 containing SNARE complex (purple rod) is targeted by both lobe A and lobe B of the COG complex to direct it to cis Golgi membranes. The TGN localized STX16 containing SNARE complex (orange rod) is targeted by lobe B of the COG complex to direct it to trans Golgi membranes.

Similar articles

Cited by

References

    1. Bonifacino JS, Glick BS. The mechanisms of vesicle budding and fusion. Cell. 2004;116:153–166. - PubMed
    1. Cottam NP, Ungar D. Retrograde vesicle transport in the Golgi. Protoplasma. 2011 - PubMed
    1. Yu IM, Hughson FM. Tethering factors as organizers of intracellular vesicular traffic. Annu Rev Cell Dev Biol. 2010;26:137–156. - PubMed
    1. Brown FC, Pfeffer SR. An update on transport vesicle tethering. Mol Membr Biol. 2010;27:457–461. - PMC - PubMed
    1. Lupashin V, Sztul E. Golgi tethering factors. Biochimica Et Biophysica Acta-Molecular Cell Research. 2005;1744:325–339. - PubMed

Publication types

MeSH terms