

Tertiary and quaternary allostery in tetrameric hemoglobin from Scapharca inaequivalvis
- PMID: 23458680
- PMCID: PMC3742685
- DOI: 10.1021/bi301620x
Tertiary and quaternary allostery in tetrameric hemoglobin from Scapharca inaequivalvis
Abstract
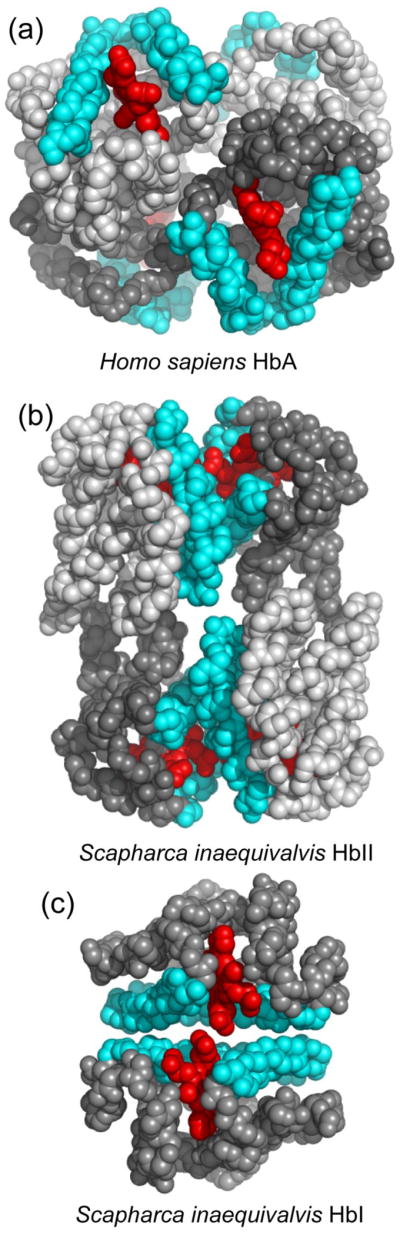
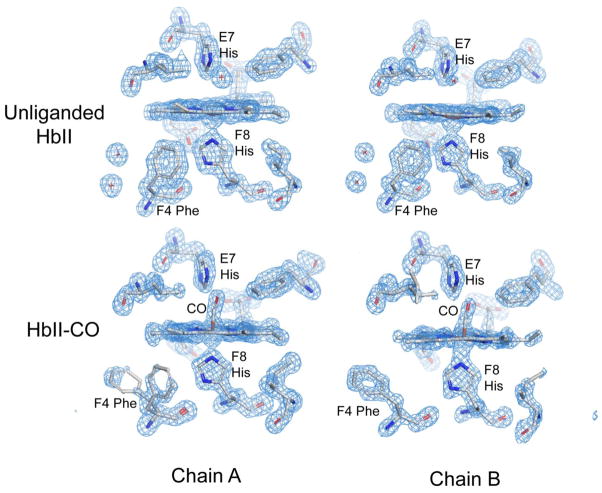
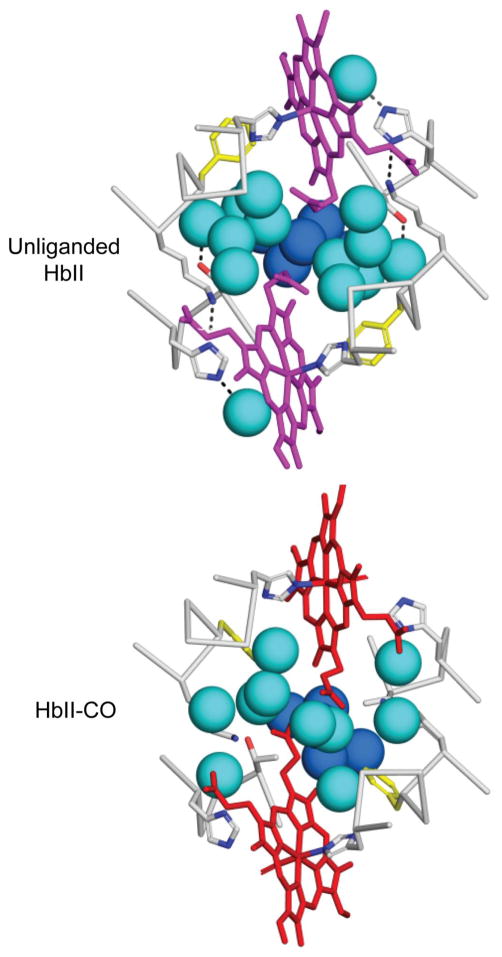
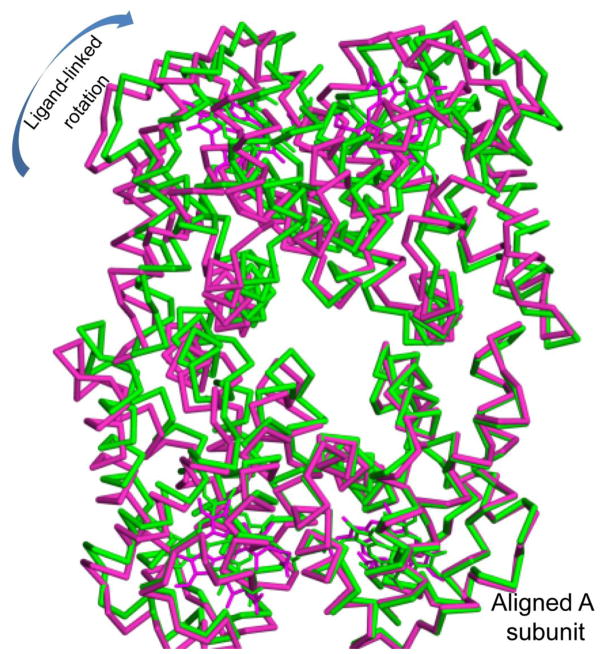
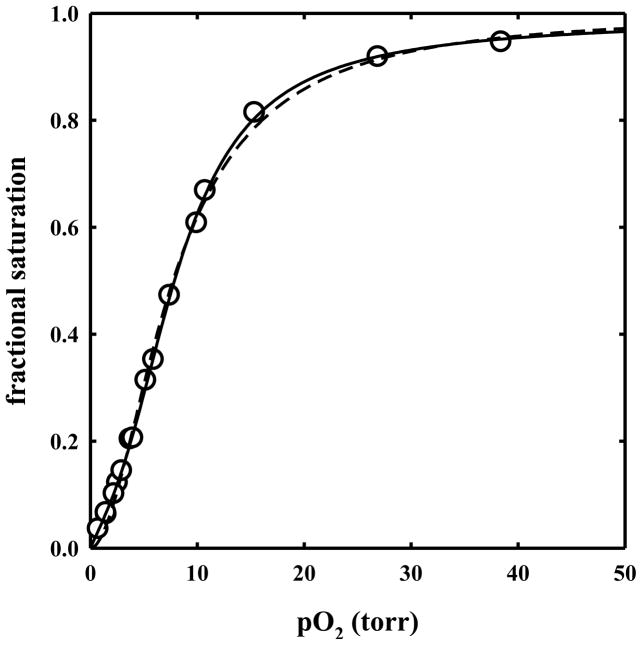
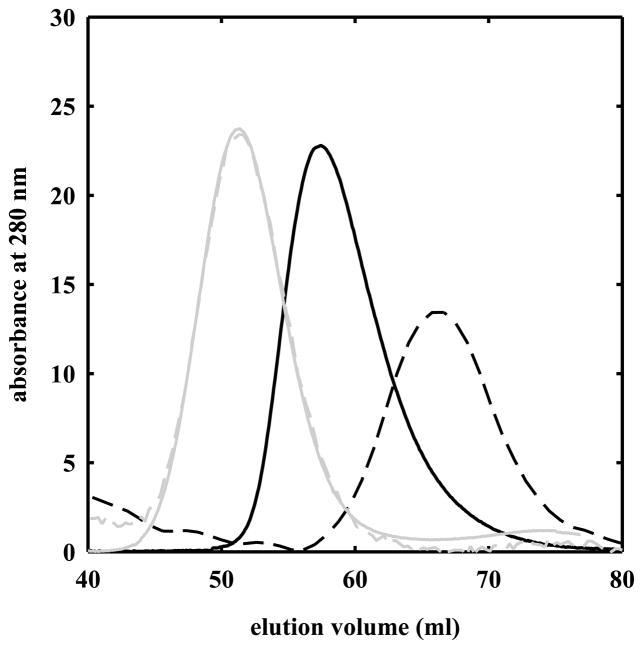
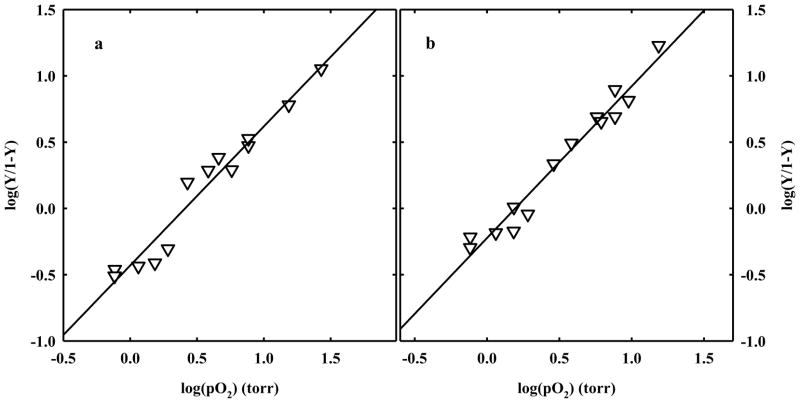
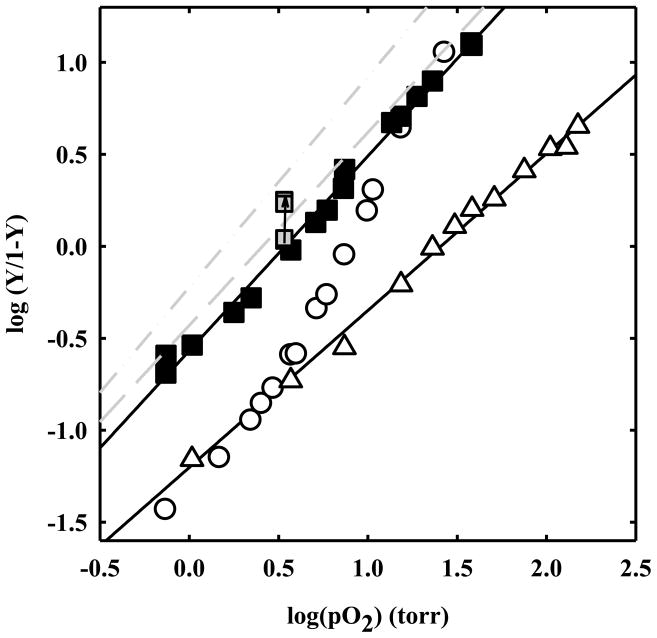
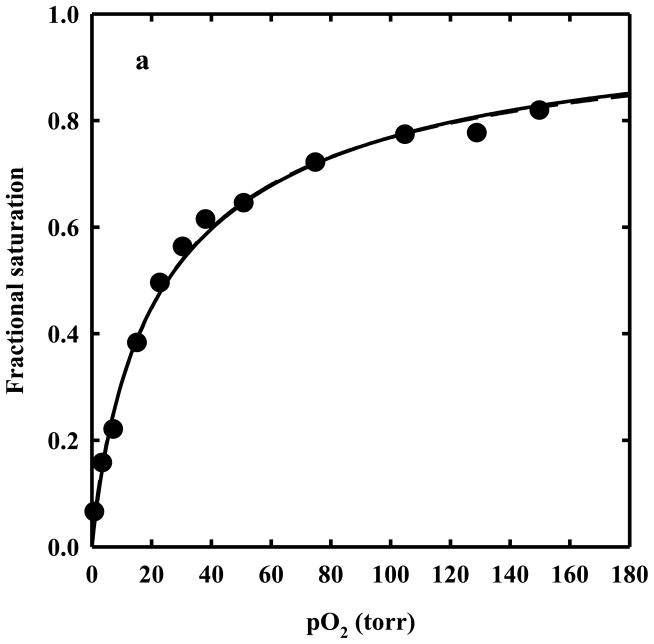
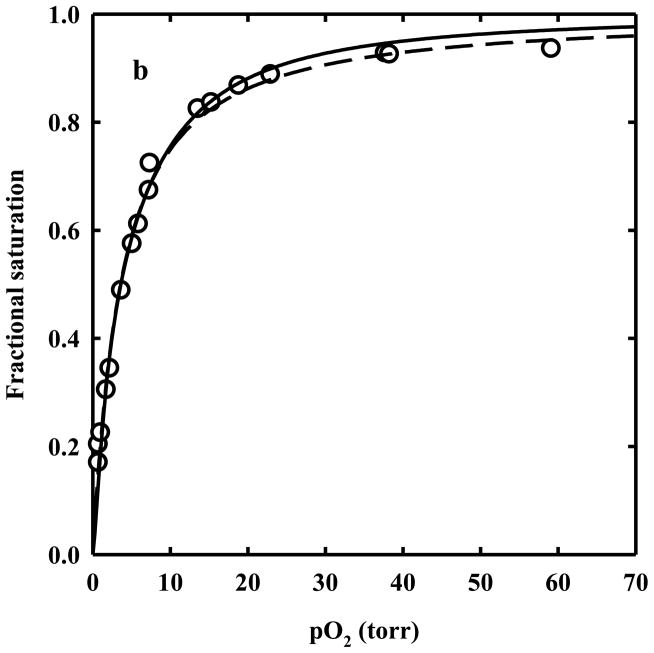
The clam Scapharca inaequivalvis possesses two cooperative oxygen binding hemoglobins in its red cells: a homodimeric HbI and a heterotetrameric A2B2 HbII. Each AB dimeric half of HbII is assembled in a manner very similar to that of the well-studied HbI. This study presents crystal structures of HbII along with oxygen binding data both in the crystalline state and in wet nanoporous silica gels. Despite very similar ligand-linked structural transitions observed in HbI and HbII crystals, HbII in the crystal or encapsulated in silica gels apparently exhibits minimal cooperativity in oxygen binding, in contrast with the full cooperativity exhibited by HbI crystals. However, oxygen binding curves in the crystal indicate the presence of a significant functional inequivalence of A and B chains. When this inequivalence is taken into account, both crystal and R state gel functional data are consistent with the conservation of a tertiary contribution to cooperative oxygen binding, quantitatively similar to that measured for HbI, and are in keeping with the structural information. Furthermore, our results indicate that to fully express cooperative ligand binding, HbII requires quaternary transitions hampered by crystal lattice and gel encapsulation, revealing greater complexity in cooperative function than the direct communication across a dimeric interface observed in HbI.
Conflict of interest statement
The authors declare no competing financial interests.
Figures

Similar articles
-
Cooperative Protein Dynamics of Heterotetrameric Hemoglobin from Scapharca inaequivalvis.J Phys Chem B. 2024 Aug 8;128(31):7558-7567. doi: 10.1021/acs.jpcb.4c03917. Epub 2024 Jul 29. J Phys Chem B. 2024. PMID: 39072557
-
Ligand-linked structural transitions in crystals of a cooperative dimeric hemoglobin.Biochemistry. 2003 Apr 29;42(16):4640-7. doi: 10.1021/bi027136p. Biochemistry. 2003. PMID: 12705827
-
The 2.0 A crystal structure of Scapharca tetrameric hemoglobin: cooperative dimers within an allosteric tetramer.J Mol Biol. 1995 Oct 13;253(1):168-86. doi: 10.1006/jmbi.1995.0543. J Mol Biol. 1995. PMID: 7473710
-
Structural and thermodynamic aspects of cooperativity in the homodimeric hemoglobin from Scapharca inaequivalvis.Biophys Chem. 2000 Aug 30;86(2-3):173-8. doi: 10.1016/s0301-4622(00)00162-9. Biophys Chem. 2000. PMID: 11026682 Review.
-
Protein Structural Dynamics of Wild-Type and Mutant Homodimeric Hemoglobin Studied by Time-Resolved X-Ray Solution Scattering.Int J Mol Sci. 2018 Nov 18;19(11):3633. doi: 10.3390/ijms19113633. Int J Mol Sci. 2018. PMID: 30453670 Free PMC article. Review.
Cited by
-
From protein structure to function via single crystal optical spectroscopy.Front Mol Biosci. 2015 Apr 28;2:12. doi: 10.3389/fmolb.2015.00012. eCollection 2015. Front Mol Biosci. 2015. PMID: 25988179 Free PMC article. Review.
-
Insight into the allosteric mechanism of Scapharca dimeric hemoglobin.Biochemistry. 2014 Nov 25;53(46):7199-210. doi: 10.1021/bi500591s. Epub 2014 Nov 14. Biochemistry. 2014. PMID: 25356908 Free PMC article.
-
Genomic Insights into the Origin and Evolution of Molluscan Red-Bloodedness in the Blood Clam Tegillarca granosa.Mol Biol Evol. 2021 May 19;38(6):2351-2365. doi: 10.1093/molbev/msab030. Mol Biol Evol. 2021. PMID: 33528571 Free PMC article.
-
De novo transcriptome analysis of stressed blood clam (Anadara broughtonii) and identification of genes associated with hemoglobin.Genes Genomics. 2020 Feb;42(2):189-202. doi: 10.1007/s13258-019-00887-7. Epub 2019 Dec 3. Genes Genomics. 2020. PMID: 31797313
References
-
- Eaton WA, Henry ER, Hofrichter J, Bettati S, Viappiani C, Mozzarelli A. Evolution of allosteric models for hemoglobin. IUBMB Life. 2007;59:586–599. - PubMed
-
- Henry ER, Bettati S, Hofrichter J, Eaton WA. A tertiary two-state allosteric model for hemoglobin. Biophys Chem. 2002;98:149–164. - PubMed
-
- Perutz MF, Fermi G, Luisi B, Shaanan B, Liddington RC. Stereochemistry of cooperative mechanisms in hemoglobin. Cold Spring Harb Symp Quant Biol. 1987;52:555–565. - PubMed
Publication types
MeSH terms
Substances
Associated data
- Actions
- Actions
Grants and funding
LinkOut - more resources
Full Text Sources
Other Literature Sources
