. 2013;8(2):e57591.
doi: 10.1371/journal.pone.0057591. Epub 2013 Feb 25.

Human SCARB2 transgenic mice as an infectious animal model for enterovirus 71

Affiliations

Human SCARB2 transgenic mice as an infectious animal model for enterovirus 71

Yi-Wen Lin et al. PLoS One. 2013.

Abstract

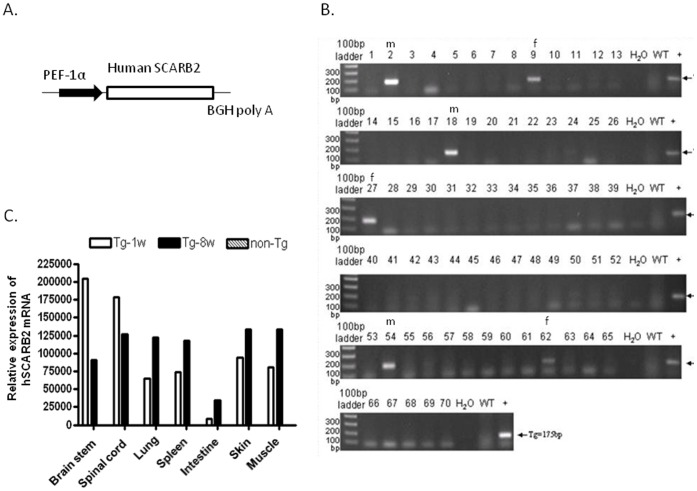
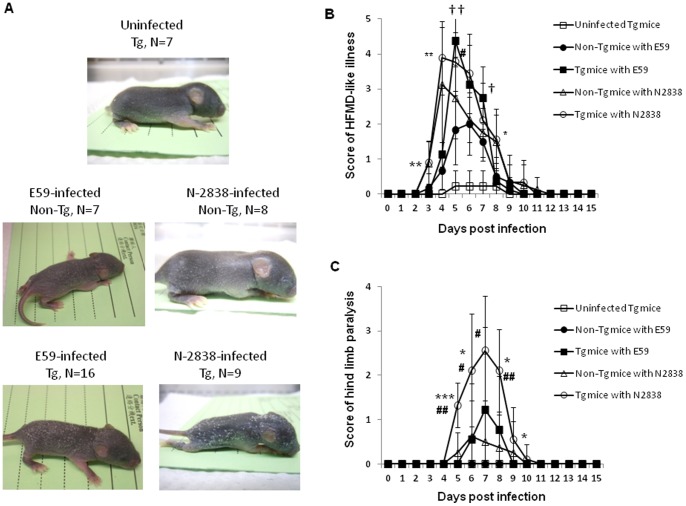
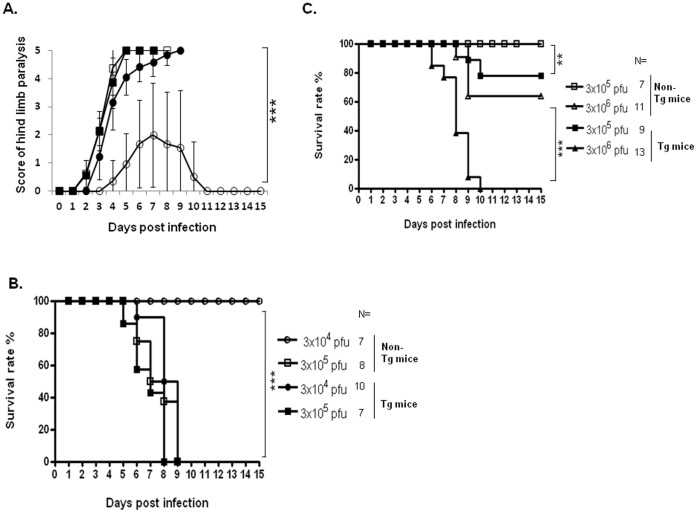
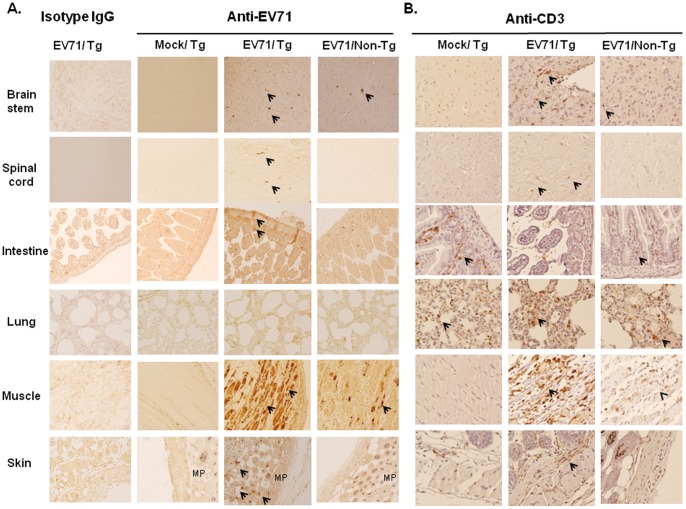
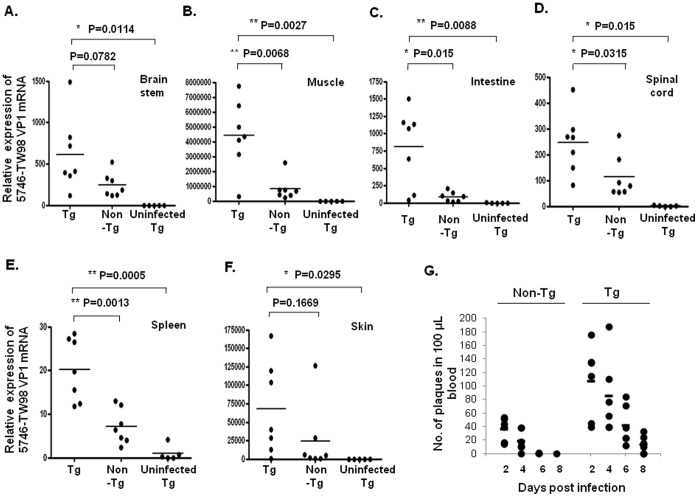
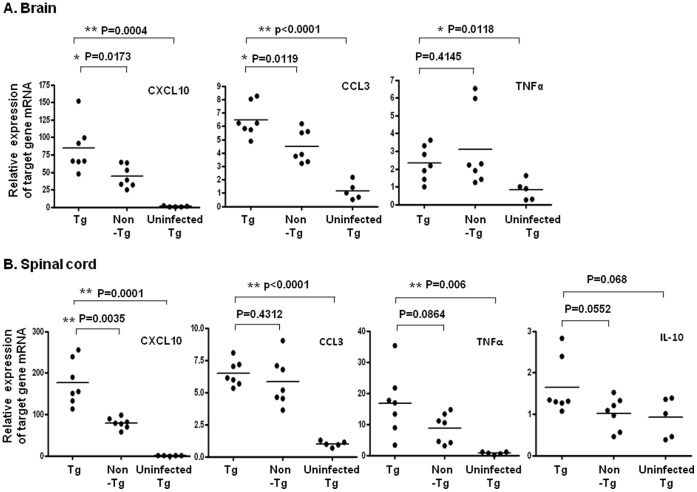
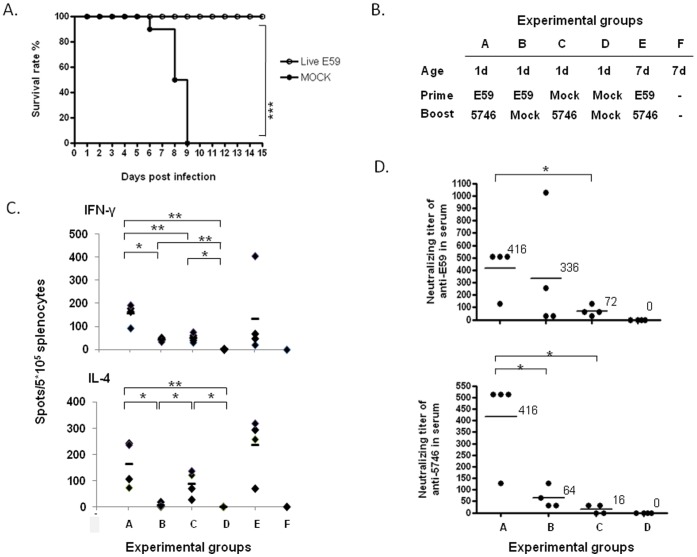
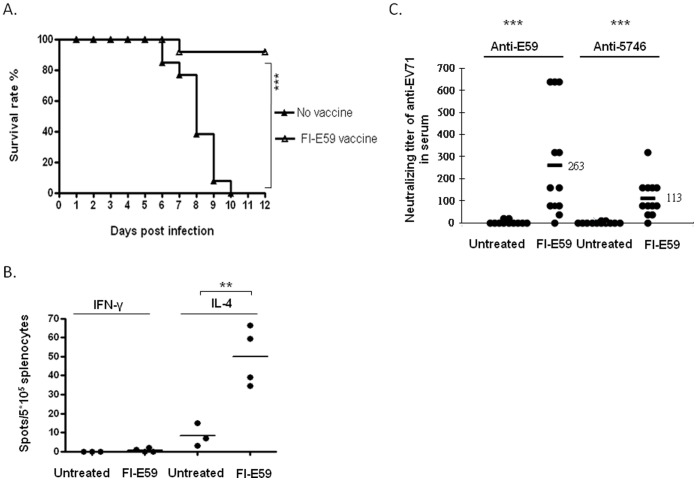
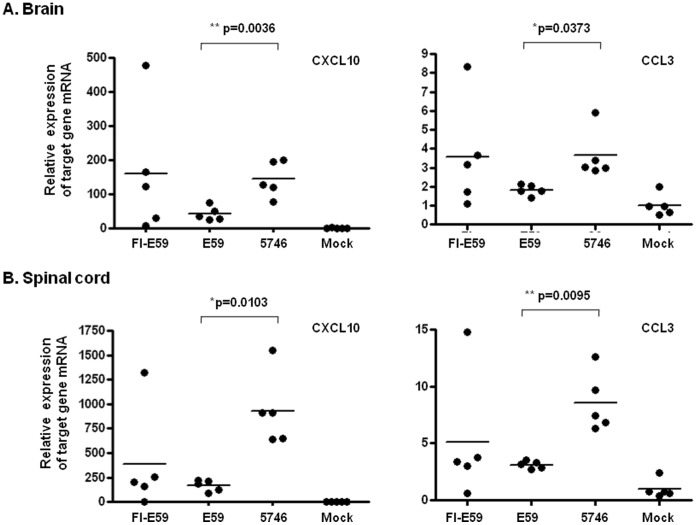
Enterovirus 71 (EV71) and coxsackievirus (CVA) are the most common causative factors for hand, foot, and mouth disease (HFMD) and neurological disorders in children. Lack of a reliable animal model is an issue in investigating EV71-induced disease manifestation in humans, and the current clinical therapies are symptomatic. We generated a novel EV71-infectious model with hSCARB2-transgenic mice expressing the discovered receptor human SCARB2 (hSCARB2). The challenge of hSCARB2-transgenic mice with clinical isolates of EV71 and CVA16 resulted in HFMD-like and neurological syndromes caused by E59 (B4) and N2838 (B5) strains, and lethal paralysis caused by 5746 (C2), N3340 (C4), and CVA16. EV71 viral loads were evident in the tissues and CNS accompanied the upregulated pro-inflammatory mediators (CXCL10, CCL3, TNF-α, and IL-6), correlating to recruitment of the infiltrated T lymphocytes that result in severe diseases. Transgenic mice pre-immunized with live E59 or the FI-E59 vaccine was able to resist the subsequent lethal challenge with EV71. These results indicate that hSCARB2-transgenic mice are a useful model for assessing anti-EV71 medications and for studying the pathogenesis induced by EV71.


Conflict of interest statement

Competing Interests: The authors have declared that no competing interests exist.

Figures

Figure 1
Figure 1. Creation and screening of hSCARB2-Tg mice.
(A) The human SCARB2 gene construct was used to create transgenic mice. The human SCARB2 was cloned under the hEF1α promoter and BGH poly A tail to obtain a pEF-1α-hSCARB2 expression vector, which was used for embryo microinjection. (B) Genomic PCR of the tail DNA of hSCARB2-Tg mice using primer set 1 (Table S1) was set to screen for the presence of the hSCARB2 transgene. The size of PCR and RT-PCR products is 175 bp. (C) Quantitative RT-PCR analysis of RNA using primer set 2 (Table S1) was extracted from different tissues of 8-wk-old and 1-wk-old transgenic mice and 8-wk-old non-transgenic mice as control to quantify hSCARB2 expression was performed. β-Actin gene expression in each tissue was used as the internal control. Each normalized 2Ct value was ratio to the value from the mean of 2Ct obtained from the muscle tissues of non-transgenic mice. A schematic representation of the hSCARB2 gene expression and the statistical average from 7 mice per group was shown.
Figure 2
Figure 2. Disease symptoms in hSCARB2-Tg mice infected with the B genotype of EV71.
(A) 1-d-old hSCARB2-Tg mice were injected s.c. with 1×10⁷ pfu of E59 (B4) or the N-2838 (B5) strain. As a negative control, 1-d-old hSCARB2-Tg mice were injected with s.c. with a VP-SFM medium, including non-Tg mice infected with 1×10⁷ pfu of E59 or N-2838. The mice were monitored daily to (B) score the HFMD-like syndrome and (C) the CNS-like hind limb paralysis, followed the criteria described in the Materials and Methods section. Data are representative of the mean scores obtained from the individual number of (N) mice per group. One-way anova with Kruskal-Wallis test was used for statistical analysis and the error bar of each group was included. Significant difference of Tg mice infected with N-2838 vs. E59 was shown as *: p<0.05, **: p<0.01, and ***: p<0.001, the Tg mice vs. non-Tg infected with E59 was shown as †: p<0.05 and ††: p<0.01, and the Tg mice vs. non-Tg infected with N-2838 was shown as #: p<0.05 and ##: p<0.01.
Figure 3
Figure 3. Lethality and neurological symptoms in mice infected with the C genotype of EV71.
Scoring of (A) CNS-like hind limb paralysis and (B) survival rate in 7-d-old hSCARB2-Tg and non-Tg mice injected with various dose of 5746 were assessed following the criteria described in the Materials and Methods section. One-way anova with Kruskal-Wallis test was used to analyze the statistic difference of hind limb paralysis observed in Tg mice s.c. infected with 3×10⁴ (•) or 3×10⁵ (▪) pfu of 5746 vs. non-Tg mice infected with 3×10⁴ (○) or 3×10⁵ (□) pfu of 5746. (C) Daily survival rate of 14-d-old hSCARB2-Tg mice s.c. infected with 3×10⁵ (▪) or 3×10⁶ (▴) pfu of 5746 or non-Tg mice infected with 3×10⁵ (□) or 3×10⁶ (Δ) pfu of 5746 were monitored. Logrank test used to analyze the statistic difference of survival rate of 5746-infected Tg vs. non-Tg mice and the error bar of each group was included. The number (N) of mice per group was shown.
Figure 4
Figure 4. In situ EV71 distribution in hSCARB2-Tg mice.
Seven-day-old hSACRB2-Tg and non-Tg mice infected with 3×10⁴ pfu of EV71 5746 s.c. were sacrificed on Day 7 post-infection. Uninfected hSCARB2-Tg mice were used as the negative control. Waxed sections of the brainstem, spinal cord, intestine, lung, biceps femoris muscle, and lower back skin were prepared and IHC stained with (A) Mab979 antibody or isotype mouse IgG and (B) the anti-CD3 antibody. All pictures were taken at 200X magnification. Viral particles or T lymphocytes in the sections are indicated with arrows. The melanin pigments (MP) pale-stained by Mab979 antibody in the section of skin tissue was observed.
Figure 5
Figure 5. Viral distribution in the tissues and organs of EV71-infected mice.
Seven-day-old hSCARB2-Tg or non-Tg mice were injected with 3×10⁴ pfu of 5746 s.c. and on Day 7 post-viral infection, RNA was extracted from the brainstem (A), muscle (B), intestine (C), spinal cord (D), spleen (E), and skin (F) of the mice and then subjected to quantitative RT-PCR analysis using primers specific to the VP1 region. β-Actin gene expression in each tissue was used as the internal control. A schematic representation of the VP1 gene expression and the statistical average from 7 mice per group is shown. (G) Peripheral blood was collected from the individual mice on Day 2, Day 4, Day 6, and Day 8 post-infection and then subjected to an immune plaque assay described in the Materials and Methods section. The results are presented as the individual number of plaques, and the calculated mean in 100 µl of blood was obtained from 5 mice per group. Unpaired student t test with Welch’s correction was used for statistical analysis.
Figure 6
Figure 6. Expression of pro-inflammatory cytokines in the CNS compartments of EV71-infected mice.
After a 7 d challenge of hSCARB2-Tg and non-Tg mice with 3×10⁴ pfu of 5746 s.c., RNA was extracted from the brainstem (A) and spinal cord (B) and quantitative RT-PCR analysis was conducted to quantify CXCL10, CCL3, TNF-α, and IL-10 genes. hSCARB2-Tg mice that received no EV71 were set as the negative control. The number of PCR cycles required for fluorescent detection of target genes was calculated and presented as the relative expression after normalization with the internal control of β-actin expression from the same tissue. A schematic representation of the target gene expression and the statistical average from 7 mice per group is shown. Unpaired student t test with Welch’s correction was used for statistical analysis.
Figure 7
Figure 7. Cross-protection of hSCARB2-Tg mice against the 5746 challenge by pre-immunization with live E59.
(A) Surviving 1-d-old hSCARB2-Tg mice were primed with 1×10⁷ pfu of live E59 s.c. (○) or medium (mock) (•) and then challenged with 3×10⁴ pfu of 5746 s.c. after 7 d. Twelve mice in the live E59 pre-immunized group and 10 mice in the mock-treated group were examined. Logrank test was used for statistical analysis. (B) Group of transgenic animals received immunization and/or challenge of EV71 was illustrated. One-day-old hSCARB2-Tg mice were immunized with 107 pfu of live E59 or mock and then challenged on Day 21 of birth with 3×10⁴ pfu 5746 or mock. In another group, 7-d-old hSCARB2-Tg mice immunized with E59 and challenged on Day 21 of birth with 5746 was included. (C) We harvested 5×10⁵ splenocytes from individual mice on Day 28 of birth and subjected them to the IFN-γ and IL-4 ELISPOT assays that were described in the Materials and Methods. Data are representative of the results derived from 2 independent experiments, each with 4 mice per group. (D) Serum samples were also collected from individual mice while sacrificed as following the schedules described in (B) and were assayed for the titer of anti-E59 and anti-5746 neutralizing antibodies described in the Materials and Methods section. The results were expressed as titers for each test sample. Bars correspond to the mean titers for each experimental group. Unpaired student t test with Welch’s correction was used for statistical analysis of (C) and (D).
Figure 8
Figure 8. Protection of hSCARB2-Tg mice from 5746 challenge by formalin-inactivated E59 vaccine.
Survival of hSCARB2-Tg mice intramuscularly pre-immunized twice with (Δ) or without (▴) 1 µg of FI-E59 on Day 1 and Day 8 of birth prior to being challenged with 3×10⁶ pfu of 5746 s.c. Twelve mice in the FI-E59 vaccine-treated group and 13 mice in the untreated group were examined. Logrank test was used for statistical analysis. (B) After the immunization of 1 µg of FI-E59 on Day 1 and Day 8 of birth, mice were sacrificed on Day 14 of birth and the spleens were pooled from 3 individual mice and the isolated 5×10⁵ splenocytes per well were subjected to the IFN-γ and IL-4 ELISPOT assays. Data are representative of the results derived from 2 independent experiments, each with 4 mice per group. (C) Serum samples collected from individual mice on Day 14 of birth prior to being challenged with 3×10⁵ pfu of 5746 s.c. were assayed for the titer of anti-E59 and anti-5746 neutralizing antibodies described in the Materials and Methods section. The results were expressed as titers for each test sample. Bars correspond to the mean titers for each experimental group. Unpaired student t test with Welch’s correction was used for statistical analysis of (B) and (C).
Figure 9
Figure 9. Expression of CXCL10 and CCL3 in the CNS of different genotype of EV71- or FI-E59 vaccine-inoculated mice.
After a 7 d injection s.c. of 1-day-old hSCARB2-Tg with 1×10⁷ pfu of E59, 3×10⁴ pfu of 5746, or 1 µg of FI-E59, RNA was extracted from the brainstem (A) and spinal cord (B) and quantitative RT-PCR analysis was conducted to quantify CXCL10 and CCL3 genes. hSCARB2-Tg mice that received no EV71 (mock) were set as the negative control. The relative expression of chemokines was calculated as described in the legend of Fig. 6. The statistical average from 5 mice per group is shown. Unpaired student t test with Welch’s correction was used for statistical analysis.

Similar articles

Cited by

References

    1. AbuBakar S, Chee HY, Al-Kobaisi MF, Xiaoshan J, Chua KB, et al. (1999) Identification of enterovirus 71 isolates from an outbreak of hand, foot and mouth disease (HFMD) with fatal cases of encephalomyelitis in Malaysia. Virus Res 61: 1–9. - PubMed
    1. Ho M, Chen ER, Hsu KH, Twu SJ, Chen KT, et al. (1999) An epidemic of enterovirus 71 infection in Taiwan. Taiwan Enterovirus Epidemic Working Group. N Engl J Med 341: 929–935. - PubMed
    1. Lin KH, Hwang KP, Ke GM, Wang CF, Ke LY, et al. (2006) Evolution of EV71 genogroup in Taiwan from 1998 to 2005: an emerging of subgenogroup C4 of EV71. J Med Virol 78: 254–262. - PubMed
    1. Lu CH, Huang SW, Lai YL, Lin CP, Shih CH, et al. (2008) On the relationship between the protein structure and protein dynamics. Proteins 72: 625–634. - PubMed
    1. Melnick JL, Schmidt NJ, Mirkovic RR, Chumakov MP, Lavrova IK, et al. (1980) Identification of Bulgarian strain 258 of enterovirus 71. Intervirology 12: 297–302. - PubMed

Publication types

MeSH terms

Substances

Grants and funding

This work was supported by grants (99-2323-B-400-014- and 100-2311-B-400-003) from the Taiwan National Science Council (http://web1.nsc.gov.tw/). The funders had no role in study design, data collection and analysis, decision to publish, or preparation of the manuscript.