

The transcobalamin receptor knockout mouse: a model for vitamin B12 deficiency in the central nervous system
- PMID: 23430977
- PMCID: PMC3659357
- DOI: 10.1096/fj.12-219055
The transcobalamin receptor knockout mouse: a model for vitamin B12 deficiency in the central nervous system
Abstract
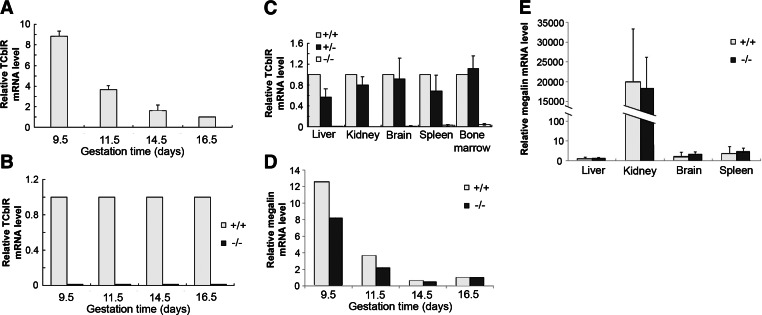
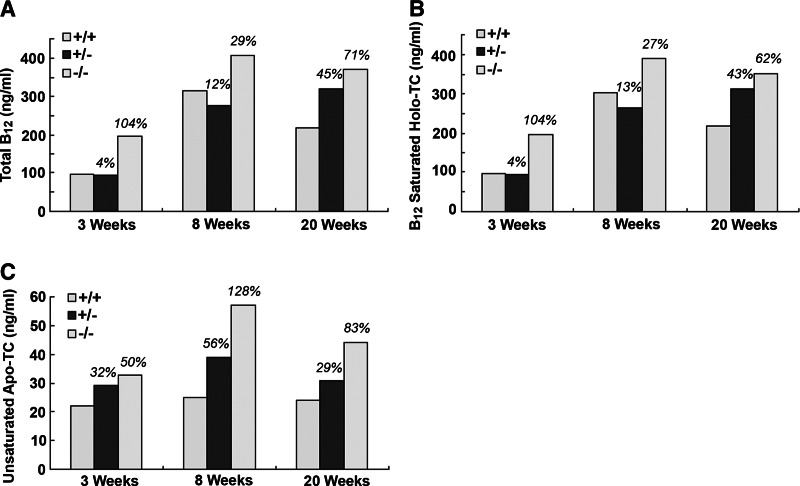
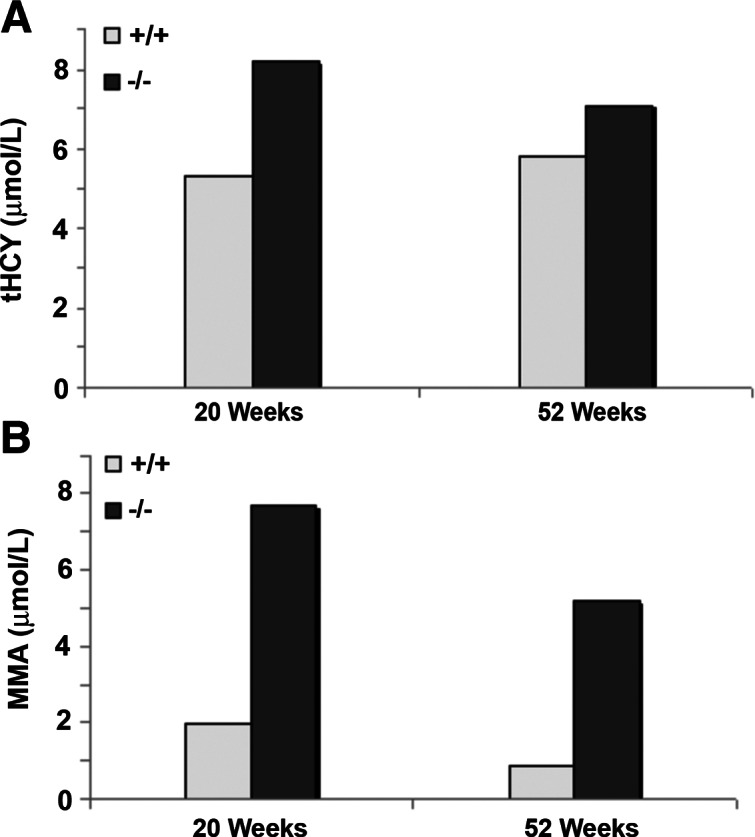
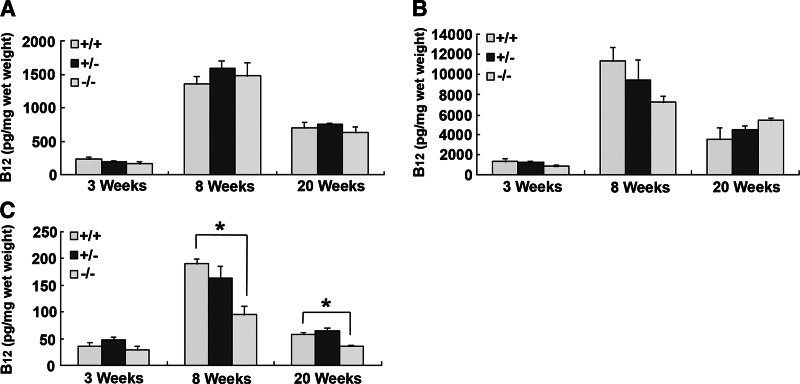
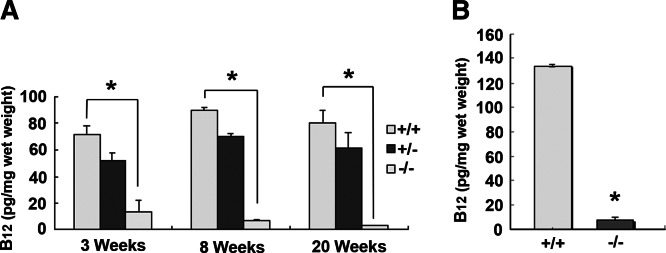
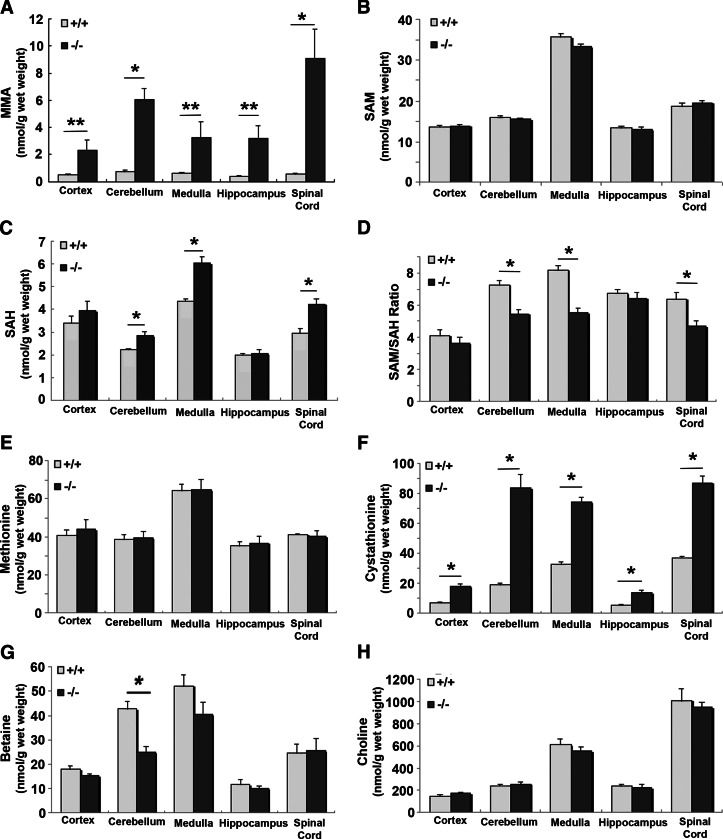
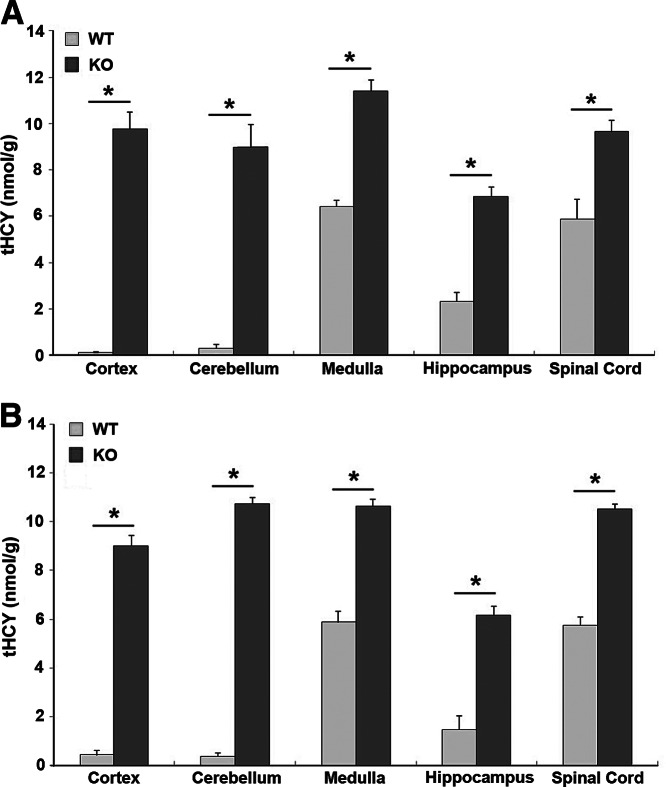
The membrane receptor (TCblR/CD320) for transcobalamin (TC)-bound cobalamin (Cbl) facilitates the cellular uptake of Cbl. A genetically modified mouse model involving ablation of the CD320 gene was generated to study the effects on cobalamin homeostasis. The nonlethal nature of this knockout and the lack of systemic cobalamin deficiency point to other mechanisms for cellular Cbl uptake in the mouse. However, severe cobalamin depletion in the central nervous system (CNS) after birth (P<0.01) indicates that TCblR is the only receptor responsible for Cbl uptake in the CNS. Metabolic Cbl deficiency in the brain was evident from the increased methylmalonic acid (P<0.01-0.04), homocysteine (P<0.01), cystathionine (P<0.01), and the decreased S-adenosylmethionine/S-adenosyl homocysteine ratio (P<0.01). The CNS pathology of Cbl deficiency seen in humans may not manifest in this mouse model; however, it does provide a model with which to evaluate metabolic pathways and genes affected.
Keywords: CD320; cellular uptake; homocysteine; methylmalonic acid; nullizygous.
Figures
Similar articles
-
Maternofetal transport of vitamin B12: role of TCblR/CD320 and megalin.FASEB J. 2017 Jul;31(7):3098-3106. doi: 10.1096/fj.201700025R. Epub 2017 Mar 28. FASEB J. 2017. PMID: 28351841 Free PMC article.
-
Mice lacking the transcobalamin-vitamin B12 receptor, CD320, suffer from anemia and reproductive deficits when fed vitamin B12-deficient diet.Hum Mol Genet. 2018 Oct 15;27(20):3627-3640. doi: 10.1093/hmg/ddy267. Hum Mol Genet. 2018. PMID: 30124850 Free PMC article.
-
Cellular uptake of vitamin B12: Role and fate of TCblR/CD320, the transcobalamin receptor.Exp Cell Res. 2020 Nov 1;396(1):112256. doi: 10.1016/j.yexcr.2020.112256. Epub 2020 Sep 6. Exp Cell Res. 2020. PMID: 32898552
-
Cellular uptake of cobalamin: transcobalamin and the TCblR/CD320 receptor.Biochimie. 2013 May;95(5):1008-18. doi: 10.1016/j.biochi.2013.02.004. Epub 2013 Feb 14. Biochimie. 2013. PMID: 23415653 Free PMC article. Review.
-
Cobalamin transport proteins and their cell-surface receptors.Expert Rev Mol Med. 2003 Jun 13;5(18):1-18. doi: 10.1017/S1462399403006422. Expert Rev Mol Med. 2003. PMID: 14585166 Review.
Cited by
-
Transcobalamin receptor antibodies in autoimmune vitamin B12 central deficiency.Sci Transl Med. 2024 Jun 26;16(753):eadl3758. doi: 10.1126/scitranslmed.adl3758. Epub 2024 Jun 26. Sci Transl Med. 2024. PMID: 38924428 Free PMC article.
-
A Historical Review of Brain Drug Delivery.Pharmaceutics. 2022 Jun 16;14(6):1283. doi: 10.3390/pharmaceutics14061283. Pharmaceutics. 2022. PMID: 35745855 Free PMC article. Review.
-
Cell Type-Specific Modulation of Cobalamin Uptake by Bovine Serum.PLoS One. 2016 Nov 28;11(11):e0167044. doi: 10.1371/journal.pone.0167044. eCollection 2016. PLoS One. 2016. PMID: 27893837 Free PMC article.
-
Metabolic etiologies in West syndrome.Epilepsia Open. 2018 Mar 14;3(2):134-166. doi: 10.1002/epi4.12102. eCollection 2018 Jun. Epilepsia Open. 2018. PMID: 29881795 Free PMC article. Review.
-
Glucocorticoid Receptor Activation Restores Learning Memory by Modulating Hippocampal Plasticity in a Mouse Model of Brain Vitamin B12 Deficiency.Mol Neurobiol. 2021 Mar;58(3):1024-1035. doi: 10.1007/s12035-020-02163-2. Epub 2020 Oct 20. Mol Neurobiol. 2021. PMID: 33078371
References
-
- Lindenbaum J., Healton E. B., Savage D. G., Brust J. C., Garrett T. J., Podell E. R., Marcell P. D., Stabler S. P., Allen R. H. (1988) Neuropsychiatric disorders caused by cobalamin deficiency in the absence of anemia or macrocytosis. N. Engl. J. Med. 318, 1720–1728 - PubMed
-
- Chanarin I., Deacon R., Lumb M., Muir M., Perry J. (1985) Cobalamin-folate interrelations: a critical review. Blood 66, 479–489 - PubMed
-
- Cannata J. J., Focesi A., Jr., Mazumder R., Warner R. C., Ochoa S. Metabolism of propionic acid in animal tissues. XII. Properties of mammalian methylmalonyl coenzyme A mutase. J. Biol. Chem. 240, 3249–3257 - PubMed
-
- Oh R., Brown D. L. (2003) Vitamin B12 deficiency. Am. Fam. Physician 67, 979–986 - PubMed
Publication types
MeSH terms
Substances
Grants and funding
LinkOut - more resources
Full Text Sources
Other Literature Sources
Molecular Biology Databases
Miscellaneous
