. 2013 Apr;24(8):1208-21.
doi: 10.1091/mbc.E12-06-0450. Epub 2013 Feb 20.

Regulation of mRNA export by the PI3 kinase/AKT signal transduction pathway

Affiliations

Regulation of mRNA export by the PI3 kinase/AKT signal transduction pathway

Alexandre Jose Christino Quaresma et al. Mol Biol Cell. 2013 Apr.

Abstract

UAP56, ALY/REF, and NXF1 are mRNA export factors that sequentially bind at the 5' end of a nuclear mRNA but are also reported to associate with the exon junction complex (EJC). To screen for signal transduction pathways regulating mRNA export complex assembly, we used fluorescence recovery after photobleaching to measure the binding of mRNA export and EJC core proteins in nuclear complexes. The fraction of UAP56, ALY/REF, and NXF1 tightly bound in complexes was reduced by drug inhibition of the phosphatidylinositide 3-kinase (PI3 kinase)/AKT pathway, as was the tightly bound fraction of the core EJC proteins eIF4A3, MAGOH, and Y14. Inhibition of the mTOR mTORC1 pathway decreased the tight binding of MAGOH. Inhibition of the PI3 kinase/AKT pathway increased the export of poly(A) RNA and of a subset of candidate mRNAs. A similar effect of PI3 kinase/AKT inhibition was observed for mRNAs from both intron-containing and intronless histone genes. However, the nuclear export of mRNAs coding for proteins targeted to the endoplasmic reticulum or to mitochondria was not affected by the PI3 kinase/AKT pathway. These results show that the active PI3 kinase/AKT pathway can regulate mRNA export and promote the nuclear retention of some mRNAs.


Figures

FIGURE 1:
FIGURE 1:
The binding of mRNA export complex proteins, as measured by FRAP, is regulated by PI3 kinase, AKT, and mTOR. HeLa cells were transfected with EGFP-fusion proteins for UAP56, ALY/REF, and NXF1. After 48 h, cells were treated with 20 μM of the PI3 kinase inhibitor LY294002 (green circles) for 2 h, 5 μM of AKT inhibitor VIII (blue triangles) for 3.5 h, and 100 nM of the mTOR inhibitor rapamycin (red squares) for 5 h. Multiple cells were examined by FRAP over a 2-h interval in all treatment groups. The times between drug addition and photobleaching are reported as a mean. Black squares, untreated cells. Normalized fluorescence recovery curves are presented for EGFP-UAP56, EGFP-TAP/NXF1, and EGFP-ALY/REF. Also shown is EGFP-UAP56 K95N, a point mutant that cannot bind ATP. Each colored arrow marks the t1/2 of recovery for the curve of the same color. Statistical analysis of the differences between averaged FRAP curves was by paired one-tailed t test: untreated EGFP-UAP56 vs. LY294002 (p = 0.0083), AKT (p < 0.0001), rapamycin (p = 0.2799); untreated EGFP-ALY/REF vs. LY294002 (p < 0.0001), AKT (p < 0.0001), rapamycin (p < 0.0001); untreated EGFP-NXF1 vs. LY294002 (p = 0.0002), AKT (p = 0.0004), rapamycin (p = 0.4102). Means are plotted with error bars for standard errors. n, number of cells in each treatment group.
FIGURE 2:
FIGURE 2:
EGFP-UAP56 is more tightly bound at nuclear speckled domains than at sites in the nucleoplasm. HeLa cells were transfected with EGFP-UAP56 wild type, and then, after 48 h, cells were treated for 3–5 h with 25 μM LY294002. Normalized fluorescence recovery curves over time were calculated for regions of interest, including either individual speckles or regions of the nucleoplasm devoid of speckles. n, number of cells for each graph. Means were plotted, with error bars showing the standard errors for each collected time point.
FIGURE 3:
FIGURE 3:
The binding of EJC core proteins, as measured by FRAP, is regulated by PI3 kinase, AKT, and mTOR. HeLa cells were transfected with EGFP-fusion proteins. After 48 h, cells were treated with 20 μM PI3 kinase inhibitor LY294002 (green circles) for 2.5 h, 5 μM AKT inhibitor VIII (blue triangles) for 3.5 h, or 100 nM of the mTOR inhibitor rapamycin (red squares) for 4.5 h. Black squares, untreated cells. Normalized fluorescence recovery curves are presented for the EJC fusion proteins EGFP-eIF4A3, EGFP-MAGOH, and EGFP-Y14. Also shown is EGFP-eIF4A3 K88N, a point mutant that cannot bind ATP. Each colored arrow marks the t1/2 of recovery for the curve of the same color. Statistical analysis of the differences between averaged FRAP curves was by paired one-tailed t test: untreated EGFP-eIF4A3 vs. LY294002 (p = 0.0002), AKT (p = 0.0002), rapa­mycin (p = 0.0002); untreated EGFP-MAGOH vs. LY294002 (p = 0.0001), AKT (p = 0.0001), rapamycin (p = 0.0001); untreated EGFP-Y14 vs. LY294002 (p = 0.0001), AKT (p = 0.0001), rapamycin (p = 0.0527). Means are plotted with standard errors for n cells in each treatment group.
FIGURE 4:
FIGURE 4:
Inhibition of PI3 kinase or AKT increases cytoplasmic levels and reduces nuclear levels of poly(A) RNA. HeLa cells were treated for 4 h with 20 μM LY294002, 5 μM AKT inhibitor VIII, or 100 nM rapamycin before FISH. Cells were fixed for 10 min on ice and then hybridized with biotinylated 54-mer oligo(dT). The hybridized probe was detected with Alexa 488–conjugated streptavidin. Cells were counterstained with 4′,6-diamidino-2-phenylindole to identify nuclei. (A) Representative field of the poly(A) distribution in untreated HeLa cells. Scale bar, 20 μm. (B) Bar graph of poly(A) in the nucleus or cytoplasm. Values are plotted as the percentage of the total cellular poly(A). Statistical analysis of the significance of differences between untreated and treated samples is by t test. Means are plotted with SDs. ***p ≤ 0.001.
FIGURE 5:
FIGURE 5:
The separation of nuclear and cytoplasmic RNA. (A) The fidelity of nuclear and cytoplasmic RNA separation was assessed by qRT-PCR quantification of RNAs known to be restricted to the nucleus or to the cytoplasm. The small nuclear RNA 7SK was the control for the nuclear fraction. Cytochrome B mRNA is a mitochondrially encoded transcript and not present in the nucleus, making it a good cytoplasmic RNA marker. Ct values were normalized using miniUAA1 mRNA from yeast added as an internal standard to each fraction after the separation of nuclei and cytoplasm. There was very little nuclear contamination of cytoplasmic RNA and very little cytoplasmic contamination of nuclear RNA. Treatment of cells with 20 μM PI3 kinase inhibitor LY294002, 5 μM AKT inhibitor VIII, or 100 nM mTOR inhibitor rapamycin did not affect the partitioning of either 7SK RNA or cytochrome B mRNA. Each bar represents the average of two independent experiments in which triplicates were analyzed. Error bars represent the SE of the mean. ns, not significant. (B) The quality of the nuclear–cytoplasmic fractionation was also assessed by Western blotting using the large subunit of RNA polymerase II as a nuclear control and γ-tubulin as a cytoplasmic control. The results confirmed that nuclear and cytoplasmic material was cleanly separated.
FIGURE 6:
FIGURE 6:
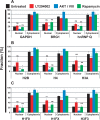
Inhibition of AKT increases cytoplasmic levels and reduces nuclear levels of endogenous mRNAs without changing total cellular levels. Cells were treated with LY294002 (20 μM), AKT inhibitor VIII (5 μM), and rapamycin (100 nM), or were untreated, for 4 h at 37°C. Specific mRNAs were quantified in the nuclear and cytoplasmic fractions by qRT-PCR. Ct values were normalized using miniUAA1 mRNA from yeast added as an internal standard to each fraction after the separation of nuclei and cytoplasm. (A) Quantitative analysis of intron-containing mRNAs in the nucleus and cytoplasm: GAPDH, BRG1, and hnRNP Q. (B) Analysis of histone mRNAs whose genes lack introns: histones H2B, H4, and H3A. (C) Analysis of spliced histone mRNAs. The genes for these transcripts contain introns: histones H1F0, H1FX, and H3F3. Each point represents the mean of two independent experiments in which triplicates were analyzed. Error bars, SEM. *p ≤ 0.05; **p ≤ 0.01; ***p ≤ 0.001; ns, not significant.
FIGURE 7:
FIGURE 7:
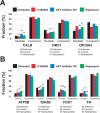
The AKT signaling pathway does not affect the nuclear export of mRNAs encoding either ER-targeted or nuclear-encoded mitochondrial proteins. Cells were treated with LY294002 (20 μM), AKT inhibitor VIII (5 μM), and rapamycin (100 nM), or were untreated, for 4 h at 37°C. Specific mRNAs were quantified in the nuclear and cytoplasmic fractions by qRT-PCR. Ct values were normalized using miniUAA1 mRNA from yeast added as an internal standard to each fraction after the separation of nuclei and cytoplasm. All mRNAs selected for analysis lacked an intron in their 5′ untranslated regions. Each point represents the mean of two independent experiments in which triplicates were analyzed. Sequence features that have been linked to the ALREX pathway are also presented (Palazzo et al., 2007; Cenik et al., 2011). These are the number of adenines in the first 70 nucleotides after the start codon and the number of leucine and hydrophobic amino acids coded for in the same region. (A) mRNAs encoding ER-targeted proteins were CALR (GO:0006984), OR10A3 (GO:0004984), and HM13 (GO:0004190). (B) Nuclear-encoded mRNAs for mitochondrial proteins were F1-ATP synthase (ATP5B; GO:0000275), FDX1 (GO:0005506), IDH3B (GO:0005962), and FH (GO:0004333). Error bars, SEM. *p ≤ 0.05; **p ≤ 0.01; ***p ≤ 0.001; ns, not significant.

Similar articles

Cited by

References

    1. Alcazar-Roman AR, Tran EJ, Guo S, Wente SR. Inositol hexakisphosphate and Gle1 activate the DEAD-box protein Dbp5 for nuclear mRNA export. Nat Cell Biol. 2006;8:711–716. - PubMed
    1. Alessi DR, Andjelkovic M, Caudwell B, Cron P, Morrice N, Cohen P, Hemmings BA. Mechanism of activation of protein kinase B by insulin and IGF-1. EMBO J. 1996;15:6541–6551. - PMC - PubMed
    1. Altomare DA, Testa JR. Perturbations of the AKT signaling pathway in human cancer. Oncogene. 2005;24:7455–7464. - PubMed
    1. Amaral PP, Clark MB, Gascoigne DK, Dinger ME, Mattick JS. lncRNAdb: a reference database for long noncoding RNAs. Nucleic Acids Res. 2011;39:D146–D151. - PMC - PubMed
    1. Amrani N, Ghosh S, Mangus DA, Jacobson A. Translation factors promote the formation of two states of the closed-loop mRNP. Nature. 2008;453:1276–1280. - PMC - PubMed

Publication types

MeSH terms

LinkOut - more resources