. 2013 Feb 14;152(4):844-58.
doi: 10.1016/j.cell.2013.01.031.

Beyond secondary structure: primary-sequence determinants license pri-miRNA hairpins for processing

Affiliations

Beyond secondary structure: primary-sequence determinants license pri-miRNA hairpins for processing

Vincent C Auyeung et al. Cell. .

Abstract

To use microRNAs to downregulate mRNA targets, cells must first process these ~22 nt RNAs from primary transcripts (pri-miRNAs). These transcripts form RNA hairpins important for processing, but additional determinants must distinguish pri-miRNAs from the many other hairpin-containing transcripts expressed in each cell. Illustrating the complexity of this recognition, we show that most Caenorhabditis elegans pri-miRNAs lack determinants required for processing in human cells. To find these determinants, we generated many variants of four human pri-miRNAs, sequenced millions that retained function, and compared them with the starting variants. Our results confirmed the importance of pairing in the stem and revealed three primary-sequence determinants, including an SRp20-binding motif (CNNC) found downstream of most pri-miRNA hairpins in bilaterian animals, but not in nematodes. Adding this and other determinants to C. elegans pri-miRNAs imparted efficient processing in human cells, thereby confirming the importance of primary-sequence determinants for distinguishing pri-miRNAs from other hairpin-containing transcripts.


Figures

Figure 1
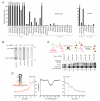
Figure 1. Existence of Unknown Features Specifying Human Pri-miRNAs
(A) Processing of human, fly, and nematode pri-miRNAs in human cells and Drosophila cells. Cells were transfected with plasmids expressing the indicated pri-miRNA hairpins with ~100 flanking genomic nucleotides on each side of each hairpin (Figure S1A), and total RNA was pooled for small-RNA sequencing. Plotted are small-RNA reads derived from the indicated pri-miRNAs. (B) Accumulation of pri-miRNA, pre-miRNA and miRNA after expressing the indicated pri-miRNAs in HEK293T cells. Pre-miRNA and mature species were measured by RNA blot of total RNA from cells transfected with plasmids expressing the indicated pri-miRNA (full gel images, including in vitro transcribed cognate positive controls, in Figure S1B). Relative pri-miRNA levels (indicated above the lanes) are from ribonuclease protection assays, normalized to the signals for neomycin phosphotransferase mRNA also expressed from each expression plasmid. (C) Relative binding of C. elegans and human pri-miRNAs to the Microprocessor. In the competitive binding assay (top, schematic), radiolabeled query pri-miRNA was mixed with the radiolabeled shorter reference pri-miRNA (human mir-125a) and incubated in excess over catalytically impaired Drosha (Drosha-TN) and DGCR8. Bound RNA was filtered on nitrocellulose and eluted for analysis on a denaturing gel. Phosphorimaging (bottom) indicated the relative amounts of input (−) and bound (+) RNAs. Numbers below each lane indicate the ratio of bound query to bound reference pri-miRNAs, normalized to their input ratio. (D) Nucleotide conservation of human pri-miRNAs conserved to mouse, reported as the average branch-length score (BLS) at each position. Positions are numbered based on the inferred Drosha cleavage site (inset); negative indices are upstream of the 5p Drosha cleavage site, indices with “P” count from the 5′ end of the pre-miRNA, and positive indices are downstream of the 3p Drosha cleavage site.
Figure 2
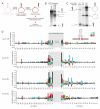
Figure 2
Selection for functional pri-miRNA variants. (A) Schematic of the selection. Pri-miRNAs with variable residues (red) flanking the Drosha cleavage site were circularized by ligation and incubated in Microprocessor lysate. Cleaved variants were gel-purified, ligated to adaptors, reverse transcribed, and amplified for high-throughput sequencing. (B) Cleavage of let-7a in HEK293T whole-cell lysate (mock) and Microprocessor lysate (whole-cell lysate from HEK293T cells transfected with plasmids expressing Drosha and DGCR8). Incubations were 1.5 h. Body-labeled reactants and products were resolved on a denaturing polyacrylamide gel and visualized by phosphorimaging. (C) Cleavage of linear and circular mir-125a (WT linear and WT circ., respectively) and a pool of circular mir-125a variants (pool). RNAs were incubated for 5 minutes in Microprocessor lysate and analyzed as in (B). The linear RNA was 5′ end-labeled; other RNAs were body-labeled. (D) Enrichment and depletion at variable residues in functional pri-miRNA variants. At each varied position (inset, red inner line), information content was calculated for each residue (green, cyan, black, and red for A, C, G, and U, respectively).
Figure 3
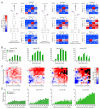
Figure 3
Basal stem structure in functional pri-miRNA variants. (A) Predicted basal secondary structures and covariation matrices for mir-125a, mir-16-1, and mir-30a. For each pair of positions, joint nucleotide distributions were tabulated from sequences of the initial and selected pools, and the log odds ratio calculated. Favored and disfavored pairs are colored red and blue, respectively, with color intensity (key) and values indicating magnitudes. (B) Relative cleavage of variants with different stem lengths. The number of contiguous Watson–Crick pairs was counted, and the relative cleavage calculated, normalized to the 8 bp stem. For selections with two time points, results are shown for both (key). (C) Enrichment for unstructured nucleotides flanking the basal stem. Predicted folds of variant sequences were generated, and the subset of sequences with wild-type basal stem pairing were classified based on the distance to the nearest consecutive structured nucleotides upstream of position –13 and the nearest consecutive structured nucleotides downstream of position +11. Enrichment (red) and depletion (blue) of unstructured lengths among the selected variants are colored (key), with black indicating that sequencing data were insufficient to calculate enrichment. (D) Relative cleavage of variants with differing numbers of total unstructured nucleotides flanking the basal stem. Upstream and downstream unstructured lengths predicted in (C) were summed, and the relative cleavage calculated, normalized to zero unstructured nucleotides. For selections with two time points, results are shown for both (key).
Figure 4
Figure 4
The basal UG motif. (A) Relative cleavage of variants with a full UG motif, a partial motif, and no motif. Values were normalized to that of variants with no motif, showing results from two time points, if available (key). (B) PhyloP conservation across 30 vertebrate species in the region of the basal UG motif (red letters) for the four selected miRNAs. Bars extending beyond the scale of the graph are truncated (pink). Nucleotides predicted to be paired in the wild-type basal stem are shaded. (C) Frequencies of A, C, G, and U (green, cyan, black, and red, respectively) at the indicated positions of human pri-miRNAs conserved to mouse. Analysis was of 204 pri-miRNAs, each representing a unique paralogous family (Table S2). (D) Enrichment for the UG dinucleotide in the pri-miRNAs of representative animals with sequenced genomes. UG occurrences were tabulated for the upstream regions of pri-miRNAs aligned on the predicted Drosha cleavage site (Table S2). Species with statistically significant enrichment at position –14 are indicated (asterisks, empirical p-value <10−3).
Figure 5
Figure 5
The downstream CNNC motif. (A) Relative cleavage of variants with a full CNNC motif, a partial motif, and no motif. Values were normalized to that of variants with no motif, showing results from two time points, if available (key). (B) PhyloP conservation across 30 vertebrate species in the region of the downstream CNNC motif (blue letters) for the four selected pri-miRNAs. Bars extending beyond the scale of the graph are truncated (pink). (C) CNNC enrichment compared to that of 63 other spaced dinucleotide motifs. Occurrences of each motif were tabulated for the downstream regions of pri-miRNAs aligned on the predicted Drosha cleavage site (Table S2). Background expectation was based on the nucleotide composition of pri-miRNA downstream regions in each species. (D) Enrichment of the CNNC motif in the pri-miRNAs of representative bilaterian animals (Table S2). Species with statistically significant enrichment at positions 16, 17, or 18 are indicated (asterisk, empirical p-value <10−4).
Figure 6
Figure 6
Binding and activity of SRp20 at the CNNC motif. (A) Site-specific crosslinking approach used to identify CNNC-binding proteins. The mir-30a crosslinking substrate contained a photoreactive base in the CNNC motif (4-thiouridine, U–S), a 3′ biotin (Bio), and for some applications, a 32P-labeled phosphate (red p). This substrate was incubated in Microprocessor lysate and irradiated with 365 nm UV light. Crosslinked complexes were captured on streptavidin-coated beads and eluted by RNase T1 digestion. (B) Proteins within crosslinked RNA–protein complexes. Crosslinked complexes prepared as in (A) were separated on an SDS gel. For each CNNC-crosslinked band, proteins are listed that were identified by mass spectrometry and have known or inferred RNA-binding activity. (C) Immunoprecipitation of proteins crosslinked to the CNNC motif. After crosslinking as in (A), complexes were enriched using monoclonal antibodies against either FLAG (the tag of the overexpressed Drosha and DGCR8), SRp20 or 9G8, and then resolved on an SDS gel. Input was run on a different region of the same gel for reference. (D) SRp20 binding downstream of mouse pri-miRNA hairpins in vivo. Sites were obtained by reanalysis of crosslinking data for SRp20 and SRp75 in mouse cells (Anko et al., 2012). Positions are numbered as in Figure 1D. Expected sites of crosslinks to any of the motif nucleotides in the region of motif enrichment (Figure 5D) are shaded (gray). (E) Enhancement of in vitro pri-miRNA cleavage by SRp20. Wildtype pri-mir-16-1 or pri-mir-16-1 with mutated CNNC were incubated for 3 minutes with immunopurified Microprocessor, supplemented with either FLAG-EGFP or 3X-FLAG-SRp20 purified from HEK293T cells. Reactants and products were resolved on denaturing polyacrylamide gels and quantified by phosphorimaging relative to a buffer-only control (geometric mean ± standard error, n = 3).
Figure 7
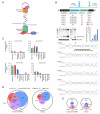
Figure 7
Structural and primary-sequence features important for human pri-miRNA processing. (A) Summary of human pri-miRNA determinants identified or confirmed in this study. (B) Processing enhancement from adding human pri-miRNA features to C. elegans mir-44. Changes that introduced the listed features were incorporated into mir-44 within the bicistronic expression vector (top). Secondary structures are shown for mutations predicted to affect the wild-type basal stem (bottom; Drosha cleavage sites, purple arrowheads). After transfection into HEK293T cells, accumulation of miR-44-3p was assessed on RNA blots (middle), with the graph plotting increased miR-44-3p expression normalized to that of the hsa-miR-1 control (geometric mean ± standard error, n = 3). Adding a CNNC to the wild-type sequence (construct mir44.5) enhanced processing ≥20 fold (geometric mean of triplicate experiment), a lower bound set by the wild-type background. (C) Contributions of individual features to in vitro processing, measured as average information content per nucleotide. If available, results from two time points are shown. (D) Enrichment of primary-sequence motifs in human pri-miRNAs conserved to mouse (Table S2). Pri-miRNAs were classified based on whether they had the basal UG, the apical GUG or UGU, or the downstream CNNC motif (left). Expectations by chance (right) were estimated based on the nucleotide composition of upstream, pre-miRNA, and downstream regions of human pri-miRNAs for the basal UG, apical GUG or UGU, and CNNC motifs, respectively. (E) A search for human motifs in C. elegans pri-miRNAs (Table S2). Pri-miRNAs were analyzed as in (D); the smaller diagrams reflect the smaller number of analyzed pri-miRNAs.

Similar articles

Cited by

References

    1. Anko ML, Muller-McNicoll M, Brandl H, Curk T, Gorup C, Henry I, Ule J, Neugebauer KM. The RNA-binding landscapes of two SR proteins reveal unique functions and binding to diverse RNA classes. Genome Biol. 2012;13:R17. - PMC - PubMed
    1. Babiarz JE, Ruby JG, Wang Y, Bartel DP, Blelloch R. Mouse ES cells express endogenous shRNAs, siRNAs, and other Microprocessor-independent, Dicer-dependent small RNAs. Genes Dev. 2008;22:2773–2785. - PMC - PubMed
    1. Bartel DP. MicroRNAs: genomics, biogenesis, mechanism, and function. Cell. 2004;116:281–297. - PubMed
    1. Bedard KM, Daijogo S, Semler BL. A nucleo-cytoplasmic SR protein functions in viral IRES-mediated translation initiation. EMBO J. 2007;26:459–467. - PMC - PubMed
    1. Bentwich I, Avniel A, Karov Y, Aharonov R, Gilad S, Barad O, Barzilai A, Einat P, Einav U, Meiri E, et al. Identification of hundreds of conserved and nonconserved human microRNAs. Nat Genet. 2005;37:766–770. - PubMed

Publication types