Synchrotron X-ray fluorescence studies of a bromine-labelled cyclic RGD peptide interacting with individual tumor cells
- PMID: 23412478
- PMCID: PMC3943546
- DOI: 10.1107/S0909049513001647
Synchrotron X-ray fluorescence studies of a bromine-labelled cyclic RGD peptide interacting with individual tumor cells
Abstract
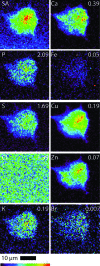
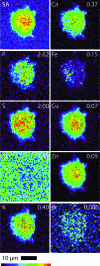
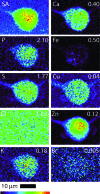
The first example of synchrotron X-ray fluorescence imaging of cultured mammalian cells in cyclic peptide research is reported. The study reports the first quantitative analysis of the incorporation of a bromine-labelled cyclic RGD peptide and its effects on the biodistribution of endogenous elements (for example, K and Cl) within individual tumor cells.
Keywords: RGD peptide; XRF; microprobe; tumor cells.
Figures


Similar articles
-
Tumor uptake of the RGD dimeric probe (99m)Tc-G3-2P4-RGD2 is correlated with integrin αvβ3 expressed on both tumor cells and neovasculature.Bioconjug Chem. 2010 Mar 17;21(3):548-55. doi: 10.1021/bc900547d. Epub 2010 Feb 25. Bioconjug Chem. 2010. PMID: 20184307
-
Evaluation of 99mTc-labeled cyclic RGD dimers: impact of cyclic RGD peptides and 99mTc chelates on biological properties.Bioconjug Chem. 2012 Mar 21;23(3):586-95. doi: 10.1021/bc200631g. Epub 2012 Mar 6. Bioconjug Chem. 2012. PMID: 22369387 Free PMC article.
-
Comparative evaluation of linear and cyclic 99mTc-RGD peptides for targeting of integrins in tumor angiogenesis.Anticancer Res. 2006 Jan-Feb;26(1A):431-4. Anticancer Res. 2006. PMID: 16475729
-
Radiolabeled cyclic RGD peptides as integrin alpha(v)beta(3)-targeted radiotracers: maximizing binding affinity via bivalency.Bioconjug Chem. 2009 Dec;20(12):2199-213. doi: 10.1021/bc900167c. Bioconjug Chem. 2009. PMID: 19719118 Free PMC article. Review.
-
Radiolabeled multimeric cyclic RGD peptides as integrin alphavbeta3 targeted radiotracers for tumor imaging.Mol Pharm. 2006 Sep-Oct;3(5):472-87. doi: 10.1021/mp060049x. Mol Pharm. 2006. PMID: 17009846 Review.
Cited by
-
Synthesis and Postpolymerization Modification of Fluorine-End-Labeled Poly(Pentafluorophenyl Methacrylate) Obtained via RAFT Polymerization.ACS Omega. 2018 Aug 22;3(8):9710-9721. doi: 10.1021/acsomega.8b01654. eCollection 2018 Aug 31. ACS Omega. 2018. PMID: 31459100 Free PMC article.
-
Further assessments of ligase LplA-mediated modifications of proteins in vitro and in cellulo.Mol Biol Rep. 2022 Jan;49(1):149-161. doi: 10.1007/s11033-021-06853-5. Epub 2021 Oct 31. Mol Biol Rep. 2022. PMID: 34718939
-
Elemental and chemically specific X-ray fluorescence imaging of biological systems.Chem Rev. 2014 Sep 10;114(17):8499-541. doi: 10.1021/cr4007297. Epub 2014 Aug 7. Chem Rev. 2014. PMID: 25102317 Free PMC article. Review. No abstract available.
-
Imaging trace element distributions in single organelles and subcellular features.Sci Rep. 2016 Feb 25;6:21437. doi: 10.1038/srep21437. Sci Rep. 2016. PMID: 26911251 Free PMC article.
-
Tracking Reactions of Asymmetric Organo-Osmium Transfer Hydrogenation Catalysts in Cancer Cells.Angew Chem Int Ed Engl. 2021 Mar 15;60(12):6462-6472. doi: 10.1002/anie.202016456. Epub 2021 Feb 15. Angew Chem Int Ed Engl. 2021. PMID: 33590607 Free PMC article.
References
-
- Alberts, B., Bray, D., Lewis, J., Raff, M., Roberts, K. & Watson, J. D. (1994). Molecular Biology of the Cell. New York: Garland.
-
- Arcangeli, A. & Becchetti, A. (2006). Trends Cell Biol. 16, 631–639. - PubMed
-
- Arcangeli, A., Faravelli, L., Bianchi, L., Rosati, B., Gritti, A., Vescovi, A., Wanke, E. & Olivotto, M. (1996). Cell Adhes. Commun. 4, 369–385. - PubMed
Publication types
MeSH terms
Substances
LinkOut - more resources
Full Text Sources
Other Literature Sources
Medical

