. 2013;8(2):e55342.
doi: 10.1371/journal.pone.0055342. Epub 2013 Feb 7.

Characterization of fragile X mental retardation protein recruitment and dynamics in Drosophila stress granules

Affiliations

Characterization of fragile X mental retardation protein recruitment and dynamics in Drosophila stress granules

Cristina Gareau et al. PLoS One. 2013.

Abstract

The RNA-binding protein Fragile X Mental Retardation (FMRP) is an evolutionarily conserved protein that is particularly abundant in the brain due to its high expression in neurons. FMRP deficiency causes fragile X mental retardation syndrome. In neurons, FMRP controls the translation of target mRNAs in part by promoting dynamic transport in and out neuronal RNA granules. We and others have previously shown that upon stress, mammalian FMRP dissociates from translating polysomes to localize into neuronal-like granules termed stress granules (SG). This localization of FMRP in SG is conserved in Drosophila. Whether FMRP plays a key role in SG formation, how FMRP is recruited into SG, and whether its association with SG is dynamic are currently unknown. In contrast with mammalian FMRP, which has two paralog proteins, Drosophila FMR1 (dFMRP) is encoded by a single gene that has no paralog. Using this genetically simple model, we assessed the role of dFMRP in SG formation and defined the determinants required for its recruitment in SG as well as its dynamics in SG. We show that dFMRP is dispensable for SG formation in vitro and ex vivo. FRAP experiments showed that dFMRP shuttles in and out SG. The shuttling activity of dFMRP is mediated by a protein-protein interaction domain located at the N-terminus of the protein. This domain is, however, dispensable for the localization of dFMRP in SG. This localization of dFMRP in SG requires the KH and RGG motifs which are known to mediate RNA binding, as well as the C-terminal glutamine/asparagine rich domain. Our studies thus suggest that the mechanisms controlling the recruitment of FMRP into SG and those that promote its shuttling between granules and the cytosol are uncoupled. To our knowledge, this is the first demonstration of the regulated shuttling activity of a SG component between RNA granules and the cytosol.


Conflict of interest statement

Competing Interests: The authors have declared that no competing interests exist.

Figures

Figure 1
Figure 1. Stress induces partial translocation of dFMRP from dissociating polysomes and its accumulation in SG.
(A–C) Sucrose gradient analysis of polysomes and analysis of dFMRP distribution on polysomes. (A) Schneider cells were untreated (left panels) or treated either with arsenite (0.5 mM; center panel) or heat shock at 37°C (right panel) for 1.5 h. Cytoplasmic extracts were sedimented through sucrose density gradients and dFMRP distribution was analyzed by western blot using specific antibodies. (B) eIF2α phosphorylation. Schneider cells were treated with arsenite (0.5 mM) or incubated under heat shock conditions (37°C) for 1.5 h. Total cell lysates were then prepared and analyzed by western blot for the phosphorylation of eIF2α using specific antibodies. Total eIF2α was analyzed using the pan-eIF2α antibodies. The amount of phosphorylated eIF2α was determined by quantitation of the film signals by densitometry using the Adobe Photoshop and expressed as a percentage of total eIF2α. The results are representative of 5 different experiments. (C–D) Schneider cells were treated with 0.5 mM arsenite or heat shock (37°C) for 1.5 h, fixed, permeabilized, and processed for immunofluorescence using antibodies against different SG markers: dPABP and deIF4E; (red signal in merged pictures) and dFMRP (green signal in merged pictures). DAPI (blue signal in merged pictures) is used as a nuclear stain. Pictures were taken using a 63X objective at 1.5 zoom (C). The percentage of cells harboring SG (>3 granules/cell) from 5 different fields and 5 different experiments containing a total of 2,000 cells is indicated at the bottom of merged images. Scale bars are indicated. (D) Densitometry of dFMRP immunofluorescence signal in SG with Adobe Photoshop. The number of pixels and mean intensities were recorded for the selected regions (SG, cytoplasm and background) using Photoshop. The mean intensity was multiplied by the number of pixels for the region selected to obtain the absolute intensity. The absolute intensity of the background region was subtracted from each region of interest. To compare the intensity between two given regions of interest, relative intensities were next calculated. Relative intensities correspond to the absolute intensities normalized to the absolute intensity of the region of reference.
Figure 2
Figure 2. Reducing dFMRP levels has no effect on SG formation.
(A) Schneider cells were treated with non-specific or dFMRP-selective siRNAs 1 and 2 for 96 h. Cells were lysed and protein extracts were prepared and analyzed by western blot to detect dFMRP and dPABP proteins (loading standards) using the appropriate antibodies. The percentage of dFMRP knockdown was determined by quantification of the film signal by densitometry using Photoshop and expressed as a percentage of total dPABP. Asterix denotes a lower migrating band reacting with anti-dFMRP antibodies. (B) Ovaries extracts were prepared and analysed by western blot for dFMRP expression using anti-dFMRP antibodies. Asterix denotes a lower migrating band reacting with anti-dFMRP antibodies. (C) Schneider cells were treated with non-specific or dFMRP-selective siRNAs 1 and 2 for 96 h. Cells were treated with arsenite (0.5 mM) for 1.5 h and then processed for immunofluorescence as described in Fig. 1 using anti-dFMRP (green signal in merged pictures) and anti-dPABP (red signal in merged pictures) antibodies. DAPI is used as a nuclear stain. Pictures were taken using a 63X objective. Scale bars are indicated. The percentage of cells harboring SG (indicated at the bottom of dPABP images) was calculated as in Fig. 1. Arrows depict dFMRP-depleted cells. Note that the percentages of SG in dFMRP-depleted cells and mock-depleted cells are similar.
Figure 3
Figure 3. SG formation in Drosophila ovaries is not affected by dFMRP deficiency.
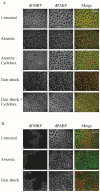
(A) Ovaries isolated from WT flies were treated with cycloheximide (100 µg/ml) for 0.5 h then were either heat-shocked at 37°C for 3 h or incubated with 0. 5 mM arsenite for 1.5 h, in presence of cycloheximide. Ovaries were then fixed, permeabilized and processed for immunofluorescence as described in “Materials and methods”. SG were visualized using both anti-dFMRP and anti-dPABP antibodies. Note that both heat shock and arsenite induces SG formation according to a process that is prevented by the addition of cycloheximide. (B) The formation of SG was assessed in Drosophila ovaries harboring clonal dFMRP-knockout cells and cells expressing dFMRP. Ovaries were treated with either heat shock for 3 h at 37°C or incubated with 0. 5 mM arsenite for 1.5 h, permeabilized and processed for immunofluorescence. SG formation was assessed using anti-dPABP antibodies. Anti-dFMRP serves to distinguish between dFMRP-positive and -negative clones in the analyzed ovaries. We observed at least 20 clones for each condition, and the phenotype is penetrant at 100%. Scale bars in A and B are indicated.
Figure 4
Figure 4. Localization of GFP-dFMRP fusion proteins in SG as analyzed in fixed cells.
(A) Schematic representation of GFP-dFMRP (top) and its deletion versions. (B) Schneider cells were transfected with either GFP or GFP-dFMRP constructs for 48 h. Cells-expressing GFP-dFMRP were then collected and protein extracts were next analyzed by immunoblotting for GFP-dFMRP expression using anti-GFP antibodies. Tubulin was used as a loading control. (C–D) Schneider cells were transfected with either GFP or GFP-dFMRP constructs for 48 h. Cells were then fixed and then processed for immunofluorescence to detect GFP or GFP-dFMRP (green). The intracellular localization of endogenous dPABP (C; red) is revealed using antibodies specific to dPABP. The indicated percentage of dFMRP-granules harboring dPABP (D) is calculated from 3 different experiments containing a total of 500 transfected cells. Scale bars are indicated. (E) Schneider cells were transfected with either GFP or GFP-dFMRP constructs for 48 h. Cells were then treated with arsenite (0.5 mM; 1.5 h), fixed and processed for immunofluorescence to detect dPABP using specific antibodies (red signal). GFP and GFP-dFMRP are detected as green fluorescence. Scale bars are indicated.
Figure 5
Figure 5. Localization of GFP-dFMRP fusion proteins in SG as visualized in live cells.
Schneider cells were transfected with GFP-dFMRP fusion proteins. After 48 h, SG were induced with arsenite (0.5 mM) and cells were observed in live by confocal microscopy over 1.5 h. Image acquisitions were taken every 3 min. The same cells are shown for GFP-dFMRP protein fluorescence (top panels) and DIC (bottom panels), at zero and 1.5 h. Scale bars are indicated.
Figure 6
Figure 6. Analysis of GFP-dFMRP and GFP-ΔPP kinetics in SG by FRAP.
(A–C) Schneider cells were transfected with either GFP-dFMRP or GFP-ΔPP and 48 h post transfections, SG were induced with arsenite (0.5 mM) for 1.5 h. A single SG (red circle; indicated by arrow) was photobleached and fluorescence recovery was recorded over 140 s using confocal microscopy. FRAP methodology is described in detail in “Materials and methods”. The indicated merged DIC and fluorescence images in (A) are selected for illustration. The recovery of dFMRP fluorescence in the photobleached area was quantified and plotted as a function of time, as indicated in (B). Curves are representative of 3 independent experiments with a total of 100 photobleached granules for each GFP fusion protein. (C) Bar graphs of MF for GFP-dFMRP and its ΔPP mutant are indicated with error bars corresponding to the SD of 3 independent experiments. The indicated P-values were calculated using an unpaired Student’s t-test (n = 3).

Similar articles

Cited by

References

    1. Ashley CT, Sutcliffe JS, Kunst CB, Leiner HA, Eichler EE, et al. (1993) Human and murine FMR-1: alternative splicing and translational initiation downstream of the CGG-repeat. Nature genetics 4: 244–251. - PubMed
    1. Khandjian EW, Fortin A, Thibodeau A, Tremblay S, Cote F, et al. (1995) A heterogeneous set of FMR1 proteins is widely distributed in mouse tissues and is modulated in cell culture. Human molecular genetics 4: 783–789. - PubMed
    1. Siomi H, Siomi MC, Nussbaum RL, Dreyfuss G (1993) The protein product of the fragile X gene, FMR1, has characteristics of an RNA-binding protein. Cell 74: 291–298. - PubMed
    1. McLennan Y, Polussa J, Tassone F, Hagerman R (2011) Fragile x syndrome. Current genomics 12: 216–224. - PMC - PubMed
    1. Santoro MR, Bray SM, Warren ST (2012) Molecular Mechanisms of Fragile X Syndrome: A Twenty-Year Perspective. Annual review of pathology 7: 219–245 doi:10.1146/annurev-pathol-011811–132457. - DOI - PubMed

Publication types

MeSH terms

Substances

LinkOut - more resources