. 2013 May;23(5):645-57.
doi: 10.1038/cr.2013.23. Epub 2013 Feb 12.

A role for the RNA-binding protein MOS2 in microRNA maturation in Arabidopsis

Affiliations

A role for the RNA-binding protein MOS2 in microRNA maturation in Arabidopsis

Xueying Wu et al. Cell Res. 2013 May.

Abstract

microRNAs (miRNAs) play important roles in the regulation of gene expression. In Arabidopsis, mature miRNAs are processed from primary miRNA transcripts (pri-miRNAs) by nuclear HYL1/SE/DCL1 complexes that form Dicing bodies (D-bodies). Here we report that an RNA-binding protein MOS2 binds to pri-miRNAs and is involved in efficient processing of pri-miRNAs. MOS2 does not interact with HYL1, SE, and DCL1 and is not localized in D-bodies. Interestingly, in the absence of MOS2, the recruitment of pri-miRNAs by HYL1 is greatly reduced and the localization of HYL1 in D-bodies is compromised. These data suggest that MOS2 promotes pri-miRNA processing through facilitating the recruitment of pri-miRNAs by the Dicing complexes.


Figures

Figure 1
Figure 1
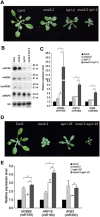
MOS2 is required for the accumulation of miRNAs, ta-siRNAs, and hc-siRNAs. (A) A catalog of photographs of Col-0 and mos2-2 plants at different developmental stages. The plants were grown under long days. (B) Small RNA northern blot analysis of miRNAs, ta-siRNAs, and hc-siRNAs in Col-0, mos2-2, hyl1-2, and a mos2-2 transgenic line containing pMOS2::MOS2-YFP transgene. Small RNAs were extracted from 3-week-old seedlings. U6 was also probed and used as a loading control. The miRNA signals were quantified and normalized to U6 RNAs, and the relative values were calculated by comparison with those in Col-0 (arbitrarily set to 1.0). (C) Photographs of 4-week-old plants with the indicated genotypes.
Figure 2
Figure 2
The effect of mos2 mutation on the expression of genes including miRNA targets. (A) Scatter plots of the FPKM of each gene in the Col-0 versus that in the mos2-2 mutant. Average FPKMs from two biological replicates were used to generate the histogram. See Supplementary information, Tables S1 and S2 for lists of genes that were down-regulated or up-regulated at least 2-fold in mos2-2. (B) Detection of the expression levels of several miRNA target genes in 3-week-old seedlings of Col-0 and mos2-2 by quantitative RT-PCR. GAPDH was used as an internal control and for normalization of the data. Error bars indicate SD (n = 3), and asterisks indicate a significant difference between the indicated samples (t test, P < 0.05).
Figure 3
Figure 3
Characterization of the mos2-2 hyl1-2 and mos2-2 ago1-25 double mutants. (A) Phenotypes of the mos2-2, hyl1-2, and mos2-2 hyl1-2 mutants. Pictures were taken from 4-week-old plants. (B) Small RNA northern blot analysis of miRNAs in Col-0, mos2-2, hyl1-2, and mos2-2 hyl1-2 plants. Small RNAs were extracted from 3-week-old seedlings. U6 was also probed and used as a loading control. (C) Detection of the expression levels of the indicated miRNA target genes in 3-week-old seedlings of Col-0, mos2-2, hyl1-2, and mos2-2 hyl1-2 plants by quantitative RT-PCR. GAPDH was used as an internal control and for normalization of the data. Error bars indicate SD (n=3) and asterisks indicate a significant difference between the indicated samples (t test, P < 0.05). (D) Phenotypes of the mos2-2, ago1-25, and mos2-2 ago1-25 mutants. Pictures were taken from 4-week-old plants. (E) Detection of the expression levels of the indicated miRNA target genes in 3-week-old seedlings of Col-0, mos2-2, ago1-25, and mos2-2 ago1-25 by quantitative RT-PCR. GAPDH was used as an internal control and for normalization of the data. Error bars indicate SD (n = 3) and asterisks indicate a significant difference between the indicated samples (t test, P < 0.05).
Figure 4
Figure 4
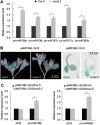
MOS2 is involved in pri-miRNA processing. (A) Detection of the expression levels of the indicated pri-miRNAs in the Col-0 and mos2-2 seedlings by quantitative RT-PCR. Error bars indicate SD (n = 3), and asterisks indicate a significant difference between the indicated samples (t test, P < 0.05). (B) Representative GUS staining images of pMIR159b::GUS (inflorescences), pMIR398c::GUS (5-day-old seedlings) transgenic plants in Col-0 and mos2-2 backgrounds. (C) Quantitative RT-PCR analysis of the transcript levels of GUS and pri-miRNAs in the indicated plants. Error bars indicate SD (n = 3), and asterisks indicate a significant difference between the indicated samples (t test, P < 0.05).
Figure 5
Figure 5
MOS2 binds to pri-miRNAs in vitro and in vivo. (A) Primary sequence and secondary structure of pri-miR159b used in EMSA assays. The miRNA and miRNA* sequences are highlighted in red and blue, respectively. (B) EMSAs were carried out with 0.5 pmol of labeled pri-miR159b transcripts and increasing amounts (0.5-4 pmols) of MOS2 recombinant proteins (left panel). A Coomassie staining gel is shown to indicate the amount and purity of MOS2. In the competition experiments, four pmols of MOS2, 0.5 pmol of labeled pri-miR159b, and increasing amounts (0.1 to 2 pmols) of unlabeled pri-miR159b (middle panel) and GAPDH (right panel) transcripts were added in the reactions. (C) Cross-linked nuclear extracts from Col-0 and FLAG-MOS2 transgenic plants were immunoprecipitated with anti-FLAG antibody. RNAs were isolated from the nuclear extracts and immunoprecipitates and analyzed by semi-quantitative RT-PCR using specific primers to detect the indicated pri-miRNAs. FLAG-MOS2 was detected by immunoblot using anti-MOS2 antibody.
Figure 6
Figure 6
MOS2 does not interact with known protein components in D-bodies. (A) Localization of MOS2-YFP and HYL1-YFP in N. benthaniana cells. N. benthamiana leaves were agroinfiltrated with pMOS2::MOS2-YFP and pHYL1::HYL1-YFP constructs. YFP fluorescence was observed two days post agroinfiltration. Nuclei were labeled with DAPI and pseudocolored in red. Bar = 5 μm. (B) Pair-wise BiFC experiments between MOS2, SE, DCL1 and HYL1. Protein partners were fused to an N-terminal fragment or C-terminal fragment of YFP, respectively, and co-infiltrated into N. benthaniana leaves. Nuclei were labeled with DAPI and pseudocolored in red. Bar = 5 μm. (C) Arabidopsis protoplasts were transfected with indicated combinations of constructs. FLAG-SE, FLAG-HYL1, myc-DCL1N, and myc-DCL1C were immunoprecipitated with anti-FLAG or anti-myc antibodies. The pull-down products were analyzed by immunoblots with anti-FLAG, anti-myc, or anti-HA antibodies as indicated. (D) Interactions between SE, MOS2 and HYL1 detected by yeast two-hybrid assays. The indicated constructs were transformed to the yeast AH109 strain. Growth on selective medium lacking histidine, adenine, leucine, and tryptophan (-His-Ade-Leu-Trp) or on control medium lacking only leucine and tryptophan (-Leu-Trp) is shown.
Figure 7
Figure 7
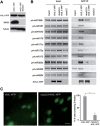
MOS2 facilitates the recruitment of pri-miRNAs by HYL1 and the localization of HYL1 in D-bodies. (A) HYL1-YFP and MOS2 protein levels in 2-week-old seedlings of the indicated plants, as measured by immunoblot using YFP and MOS2 antibodies, respectively. Tubulin was also probed and served as the loading control. (B) HYL1-YFP was immunoprecipitated from the 2-week-old seedlings of the indicated plants using a GFP-specific antibody. RNAs were isolated from the nuclear extracts and immunoprecipitates and analyzed by RT-PCR with specific primers to detect the indicated pri-miRNAs. The HYL1-YFP protein was detected by anti-GFP antibody. (C) Images of nuclei in root cells of 2-week-old seedlings of the indicated plants. HYL1-YFP was localized in D-bodies in ∼95% of the Col-0 cells and it became evenly distributed in the nucleoplasm in ∼80% of the mos2-2 cells. The percentage of D-body positive nuclei was calculated based on more than 500 cells from 10 plants for each genotype. The error bars indicate SD (n = 500), and the asterisk indicates a significant difference between the samples (t test, P < 0.05). White bar = 5 μm.

Similar articles

Cited by

References

    1. Carthew RW, Sontheimer EJ. Origins and mechanisms of miRNAs and siRNAs. Cell. 2009;136:642–655. - PMC - PubMed
    1. Kim VN. MicroRNA biogenesis: coordinated cropping and dicing. Nat Rev Mol Cell Biol. 2005;6:376–385. - PubMed
    1. Kurihara Y, Watanabe Y. Arabidopsis micro-RNA biogenesis through Dicer-like 1 protein functions. Proc Natl Acad Sci USA. 2004;101:12753–12758. - PMC - PubMed
    1. Kurihara Y, Takashi Y, Watanabe Y. The interaction between DCL1 and HYL1 is important for efficient and precise processing of pri-miRNA in plant microRNA biogenesis. RNA. 2006;12:206–212. - PMC - PubMed
    1. Park W, Li J, Song R, Messing J, Chen X. CARPEL FACTORY, a Dicer homolog, and HEN1, a novel protein, act in microRNA metabolism in Arabidopsis thaliana. Curr Biol. 2002;12:1484–1495. - PMC - PubMed

Publication types

MeSH terms

Associated data