The structure of the Tiam1 PDZ domain/ phospho-syndecan1 complex reveals a ligand conformation that modulates protein dynamics
- PMID: 23395182
- PMCID: PMC4086710
- DOI: 10.1016/j.str.2013.01.004
The structure of the Tiam1 PDZ domain/ phospho-syndecan1 complex reveals a ligand conformation that modulates protein dynamics
Abstract
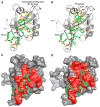
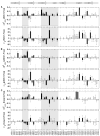
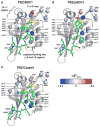
PDZ (PSD-95/Dlg/ZO-1) domains are protein-protein interaction modules often regulated by ligand phosphorylation. Here, we investigated the specificity, structure, and dynamics of Tiam1 PDZ domain/ligand interactions. We show that the PDZ domain specifically binds syndecan1 (SDC1), phosphorylated SDC1 (pSDC1), and SDC3 but not other syndecan isoforms. The crystal structure of the PDZ/SDC1 complex indicates that syndecan affinity is derived from amino acids beyond the four C-terminal residues. Remarkably, the crystal structure of the PDZ/pSDC1 complex reveals a binding pocket that accommodates the phosphoryl group. Methyl relaxation experiments of PDZ/SCD1 and PDZ/pSDC1 complexes reveal that PDZ-phosphoryl interactions dampen dynamic motions in a distal region of the PDZ domain by decoupling them from the ligand-binding site. Our data are consistent with a selection model by which specificity and phosphorylation regulate PDZ/syndecan interactions and signaling events. Importantly, our relaxation data demonstrate that PDZ/phospho-ligand interactions regulate protein dynamics and their coupling to distal sites.
Copyright © 2013 Elsevier Ltd. All rights reserved.
Figures


Similar articles
-
Distinct Roles for Conformational Dynamics in Protein-Ligand Interactions.Structure. 2016 Dec 6;24(12):2053-2066. doi: 10.1016/j.str.2016.08.019. Epub 2016 Oct 27. Structure. 2016. PMID: 27998539 Free PMC article.
-
The Tiam1 PDZ domain couples to Syndecan1 and promotes cell-matrix adhesion.J Mol Biol. 2010 May 21;398(5):730-46. doi: 10.1016/j.jmb.2010.03.047. Epub 2010 Mar 31. J Mol Biol. 2010. PMID: 20361982 Free PMC article.
-
Structural and thermodynamic analysis of PDZ-ligand interactions.Methods Enzymol. 2011;488:81-100. doi: 10.1016/B978-0-12-381268-1.00004-5. Methods Enzymol. 2011. PMID: 21195225 Free PMC article.
-
Plasticity of PDZ domains in ligand recognition and signaling.FEBS Lett. 2012 Aug 14;586(17):2638-47. doi: 10.1016/j.febslet.2012.04.015. Epub 2012 Apr 21. FEBS Lett. 2012. PMID: 22576124 Free PMC article. Review.
-
Allosterism in the PDZ Family.Int J Mol Sci. 2022 Jan 27;23(3):1454. doi: 10.3390/ijms23031454. Int J Mol Sci. 2022. PMID: 35163402 Free PMC article. Review.
Cited by
-
Distinct Roles for Conformational Dynamics in Protein-Ligand Interactions.Structure. 2016 Dec 6;24(12):2053-2066. doi: 10.1016/j.str.2016.08.019. Epub 2016 Oct 27. Structure. 2016. PMID: 27998539 Free PMC article.
-
Syndecan-4/PAR-3 signaling regulates focal adhesion dynamics in mesenchymal cells.Cell Commun Signal. 2020 Aug 18;18(1):129. doi: 10.1186/s12964-020-00629-3. Cell Commun Signal. 2020. PMID: 32811537 Free PMC article.
-
Proteome-wide analysis of phospho-regulated PDZ domain interactions.Mol Syst Biol. 2018 Aug 20;14(8):e8129. doi: 10.15252/msb.20178129. Mol Syst Biol. 2018. PMID: 30126976 Free PMC article.
-
Energy transport pathway in proteins: Insights from non-equilibrium molecular dynamics with elastic network model.Sci Rep. 2018 Jun 22;8(1):9487. doi: 10.1038/s41598-018-27745-y. Sci Rep. 2018. PMID: 29934573 Free PMC article.
-
A Simple PB/LIE Free Energy Function Accurately Predicts the Peptide Binding Specificity of the Tiam1 PDZ Domain.Front Mol Biosci. 2017 Sep 26;4:65. doi: 10.3389/fmolb.2017.00065. eCollection 2017. Front Mol Biosci. 2017. PMID: 29018806 Free PMC article.
References
-
- Adey NB, Huang L, Ormonde PA, Baumgard ML, Pero R, Byreddy DV, Tavtigian SV, Bartel PL. Threonine phosphorylation of the MMAC1/PTEN PDZ binding domain both inhibits and stimulates PDZ binding. Cancer Res. 2000;60:35–37. - PubMed
-
- Asundi VK, Carey DJ. Phosphorylation of recombinant N-syndecan (syndecan 3) core protein. Biochem Biophys Res Commun. 1997;240:502–506. - PubMed
-
- Birrane G, Chung J, Ladias JA. Novel mode of ligand recognition by the Erbin PDZ domain. J Biol Chem. 2003;278:1399–1402. - PubMed
Publication types
MeSH terms
Substances
Associated data
- Actions
- Actions
Grants and funding
LinkOut - more resources
Full Text Sources
Other Literature Sources
Molecular Biology Databases
Miscellaneous

