. 2013 Feb 6:10:2.
doi: 10.1186/1743-8977-10-2.

Deciphering the mechanisms of cellular uptake of engineered nanoparticles by accurate evaluation of internalization using imaging flow cytometry

Affiliations

Deciphering the mechanisms of cellular uptake of engineered nanoparticles by accurate evaluation of internalization using imaging flow cytometry

Sandra Vranic et al. Part Fibre Toxicol. .

Abstract

Background: The uptake of nanoparticles (NPs) by cells remains to be better characterized in order to understand the mechanisms of potential NP toxicity as well as for a reliable risk assessment. Real NP uptake is still difficult to evaluate because of the adsorption of NPs on the cellular surface.

Results: Here we used two approaches to distinguish adsorbed fluorescently labeled NPs from the internalized ones. The extracellular fluorescence was either quenched by Trypan Blue or the uptake was analyzed using imaging flow cytometry. We used this novel technique to define the inside of the cell to accurately study the uptake of fluorescently labeled (SiO2) and even non fluorescent but light diffracting NPs (TiO2). Time course, dose-dependence as well as the influence of surface charges on the uptake were shown in the pulmonary epithelial cell line NCI-H292. By setting up an integrative approach combining these flow cytometric analyses with confocal microscopy we deciphered the endocytic pathway involved in SiO2 NP uptake. Functional studies using energy depletion, pharmacological inhibitors, siRNA-clathrin heavy chain induced gene silencing and colocalization of NPs with proteins specific for different endocytic vesicles allowed us to determine macropinocytosis as the internalization pathway for SiO2 NPs in NCI-H292 cells.

Conclusion: The integrative approach we propose here using the innovative imaging flow cytometry combined with confocal microscopy could be used to identify the physico-chemical characteristics of NPs involved in their uptake in view to redesign safe NPs.


Figures

Figure 1
Figure 1
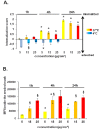
Interaction of 50 nm-FITC-SiO2 with NCI-H292. A. 3D reconstruction of a confocal analysis of the cells exposed to 50 nm-FITC-SiO2 NPs at 5 μg/cm2 for 24 h. Staining of the cells is as follows: Blue - DAPI-stained nuclei, Red – TRITC-phalloidin-stained actin filaments, Green – FITC-labelled SiO2 NPs. Scale bar shows 10 μm. B. The same field of the confocal image shown in the Figure 1A presented as a projection of all images acquired in the stack. C. 3D reconstruction of x,z and y,z-slices of the corresponding regions on the image 1A. The insert shows one selected representative cell and D. Cells were exposed to different concentrations of NPs at indicated time points, followed by FCM analysis of median fluorescence intensity (MFI) of at least 10.000 cells. Results are represented as mean MFI value ± SD, n=3 of one out of 3 independent experiments. Data were analyzed by ANOVA, followed by Bonferroni post hoc test. * significantly different from previous time point, p < 0.05.
Figure 2
Figure 2
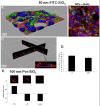
Interaction of 100 nm-Por-SiO2 NPs with NCI-H292. A. 3D reconstruction of a confocal analysis of cells exposed to 100 nm-Por-SiO2 NPs at 25 μg/cm2 for 24 h. Staining of the cells is as follows: Blue - DAPI-stained nuclei, Green - FITC-phalloidin-stained actin filaments, Red - Porphyrine-labelled SiO2 particles. Scale bar shows 10 μm. B. The same field of the confocal image shown in the Figure 2A presented as a projection of all images acquired in the stack. C. 3D reconstruction of x,z and y,z-slices of the corresponding regions of the image 2A. The insert shows one selected representative cell and D. Cells were exposed to different concentrations of NPs at indicated time points, followed by FCM analysis of median fluorescence intensity (MFI) of at least 10.000 cells. Results are represented as mean MFI value ± SD, n=3 of one out of 3 independent experiments. Data were analyzed by ANOVA, followed by Bonferroni post hoc test. * significantly different from previous time point, p < 0.05.
Figure 3
Figure 3
Determination of 50 nm-FITC-SiO2 uptake in NCI-H292 cells by flow cytometry and confocal microscopy. A. 3D reconstruction of the confocal analysis of cells exposed to 50 nm-FITC-SiO2 NPs at 5 μg/cm2 for 4 h at 37°C. Staining of the cells is as follows: Blue - DAPI-stained nuclei, Red – TRITC-phalloidin-stained actin filaments, Green – FITC-labelled SiO2 NPs. Scale bar shows 10 μm. B. The same field of the confocal image shown in the Figure 3A presented as a projection of all images acquired in the stack. C. 3D reconstruction of x,z and y,z-slices of the corresponding regions of the image 3A. The insert shows one selected representative cell and D. Cells were incubated with 50 nm-FITC-SiO2 at 37°C at indicated concentrations. Median fluorescence intensity (MFI) of at least 10.000 cells was analysed by FCM without or with 0.11% TB added just before FCM analysis. Results are represented as mean MFI value ± SD, n=3 of one out of 3 independent experiments. Data were analyzed by ANOVA, followed by Bonferroni post hoc test. * significantly different after TB addition, p < 0.05.
Figure 4
Figure 4
Determination of 50 nm-FITC-SiO2 uptake in NCI-H292 cells by flow cytometry and confocal microscopy. A. 3D reconstruction of a confocal analysis of cells exposed to 50 nm-FITC-SiO2 NPs at 5 μg/cm2 for 4 h at 4°C. Staining of the cells is as follows: Blue - DAPI-stained nuclei, Red – TRITC-phalloidin-stained actin filaments, Green – FITC-labelled SiO2 NPs. Scale bar shows 10 μm. B. The same field of the confocal image shown in the Figure 4A presented as a projection of all images acquired in the stack. C. 3D reconstruction of x,z and y,z-slices of the corresponding regions of the image 4A. The insert shows one selected representative cell and D. Cells were pre-incubated for 30 min at 4°C, and subsequently exposed to 50 nm-FITC-SiO2 at 4°C. Median fluorescence intensity (MFI) of at least 10.000 cells was analysed by FCM without or with 0.11% TB added just before FCM analysis. Results are represented as mean MFI value ± SD, n=3 of one out of 3 independent experiments.
Figure 5
Figure 5
Determination of 100 nm-Por-SiO2 uptake by NCI-H292 cells by imaging flow cytometry. A. Representative images captured by the Amnis ImageStreamX Flow Cytometer of cells treated with 100 nm-Por-SiO2 for 4 h at 37°C or 4°C. First column shows brightfield (BF) images of the cells, second column shows images of fluorescence of porphyrine (Por), third column shows fluorescence merged with the brightfield images of the cells (BF/Por) and forth column shows the applied mask eroded for 3 μm and porphyrine fluorescence (Por+Mask). B. and C. Internalization score (IS) calculated by Amnis IDEAS software: distribution of IS of at least 500 cells treated for 4 h at 37 °C or 4°C (B.), and corresponding mean value of IS ± SD of six independent experiments (C.).
Figure 6
Figure 6
Internalization of 100 nm-Por-SiO2 by NCI-H292 cells analyzed by imaging flow cytometry. A. Internalization score obtained using a mask eroded for 3 μm after treatment with 100 nm-Por-SiO2 at 37 °C or 4°C, at different concentrations and at different time points. B. Mean fluorescence intensity (MFI) inside the mask eroded for 3 μm for cells treated with 100 nm-Por-SiO2 at different time points and at different concentrations. Values are expressed as mean IS (A.) or mean value of MFI (B.) ± SD of six independent experiments analyzing at least 500 cells. Data were analyzed by ANOVA, followed by Bonferroni post hoc test. * significantly different from previous time point, p < 0.05. §significantly different from lower concentration, p < 0.05.
Figure 7
Figure 7
Energy dependence of NP internalization. A. 3D reconstruction of a confocal analysis of cells exposed to NPs and NaN3 for 4 h. Staining of the cells is as follows: Blue - DAPI-stained nuclei, Red – TRITC-phalloidin-stained actin filaments, Green – FITC-labelled SiO2 NPs. Scale bar shows 10 μm. B. The same field of the confocal image shown in the Figure  7A presented as a projection of all images acquired in the stack. C. 3D reconstruction of x,z and y,z-slices of the corresponding regions of the image 7A. and D and E. Cells were either pre-incubated at 37°C with 100 mM of NaN3 for 30 min, or incubated at 4°C before being exposed to NPs at 5 μg/cm2 for 4 h. Quantification of 50 nm-FITC–SiO2 uptake was performed by flow cytometry after addition of TB (D). Analysis of the internalization of 100 nm-Por-SiO2 NPs was performed by imaging flow cytometry using a mask eroded for 3 μm. Representative fluorescence images of cells are shown. Results are expressed as mean value of the percentage of inhibition of NP uptake (D.) or mean value of Internalization score (E.) ± SD, n=3 at least.
Figure 8
Figure 8
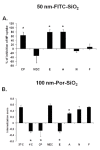
Effect of pharmacological inhibitors on the uptake of 50 nm-FITC-SiO2 and 100 nm-Por-SiO2 NPs. Cells were pre-treated with inhibitors of main endocytotic pathways: Chlorpromazine (CP) at 25 μM, Monodansylcadaverine (MDC) at 75 μM, EIPA (E) at 75 μM, Amiloride (A) at 1.5 mM, Nystatin (N) at 75 μM and Filipin (F) at 4.5 μM for 30 min and then exposed to A.: 50 nm-FITC-SiO2 NPs at 5 μg/cm2 and inhibitors for 3.5 h. Quantification of the internalization was performed by flow cytometry, after addition of TB. Results are expressed as mean percentage of inhibition of NP uptake in cells not treated with inhibitors ± SD, n = 6–18. B.: 100 nm-Por-SiO2 NPs at 15 μg/cm2 and inhibitors or at 4°C for 3.5 h. Analysis of the internalization was performed by imaging flow cytometry using a mask eroded for 3 μm. Results are expressed as mean Internalization score ± SD of four independent experiments. Data were analyzed by ANOVA, followed by Bonferroni post hoc test. * significantly different from treatment with NPs at 37°C in the absence of inhibitors, p < 0.05.
Figure 9
Figure 9
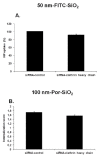
Effect of siRNA induced gene silencing of clathrin heavy chain on SiO2 NP uptake. Cells were treated with siRNA-control or siRNA-clathrin heavy chain for 72 h before treating with A.: 50 nm-FITC-SiO2 NPs for 3.5 h. Quantification of the internalization was performed by flow cytometry after addition of TB. Results are expressed as percentage of NP uptake compared to uptake in the siRNA-control treated cells, mean percentage ± SD, n = 9 B.: 15 μg/cm2 of 100 nm-Por-SiO2 NPs for 3.5 h. Analysis of the internalization was performed by imaging flow cytometry using a mask eroded for 3 μm. Results are expressed as mean Internalization score ± SD of three independent experiments.
Figure 10
Figure 10
Colocalization of SiO2 NPs with proteins specific for different endocytotic vesicles analyzed by confocal microscopy. Cells treated with SiO2 NPs for 4 h were fixed and immunolabelled with Clathrin Heavy Chain antibody (CHC, 8A and 8D), Caveolin-1 antibody (8B and 8E) and Sorting Nexin-5 antibody (SNX-5, 8C and 8F). A, B and C: 50 nm-FITC-SiO2 NPs. Staining is as follows: Blue – DAPI-stained nuclei, Red –CHC, SNX-5, and caveolin-1 labelling, Green – FITC-labelled SiO2 NPs. D, E and F: 100 nm-porphyrine-SiO2 NPs. Staining is as follows: Blue - DAPI-stained nuclei, Green – CHC, SNX-5 and caveolin-1 labelling, Red – Porphyrine-labelled SiO2 NPs. Scale bar shows 10 μm. Pearson’s coefficients were calculated and expressed as mean value ± SD for at least 3 images obtained in three independent experiments.
Figure 11
Figure 11
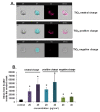
Internalization of TiO2 NPs by NCI-H292 cells analyzed by imaging flow cytometry. A. Representative images captured by Amnis ImageStreamX Flow Cytometer of cells treated with neutral, positively or negatively charged TiO2 NPs for 4 h at 20 and 40 μg/cm2. First column shows cells in the brightfield (BF), second shows the mask eroded for 3 μm, third column shows the signal of the side scatter (SS) and forth column shows images of the brightfield merged with the side scatter signal (BF/SS). B. Intensity of the side scatter signal inside the mask eroded for 3 μm. Results are expressed as mean value ± SD of three independent experiments analyzing at least 500 cells. Data were analyzed by ANOVA followed by Bonferroni post hoc test. * significantly different from control, p < 0.05.

Similar articles

Cited by

References

    1. Geiser M, Kreyling WG. Deposition and biokinetics of inhaled nanoparticles. Part Fibre Toxicol. 2010;7:2. doi: 10.1186/1743-8977-7-2. - DOI - PMC - PubMed
    1. Hauck TS, Ghazani AA, Chan WC. Assessing the effect of surface chemistry on gold nanorod uptake, toxicity, and gene expression in mammalian cells. Small. 2008;4:153–159. doi: 10.1002/smll.200700217. - DOI - PubMed
    1. Anas A, Okuda T, Kawashima N, Nakayama K, Itoh T, Ishikawa M, Biju V. Clathrin-mediated endocytosis of quantum dot-peptide conjugates in living cells. ACS Nano. 2009;3:2419–2429. doi: 10.1021/nn900663r. - DOI - PubMed
    1. Alkilany AM, Nagaria PK, Hexel CR, Shaw TJ, Murphy CJ, Wyatt MD. Cellular uptake and cytotoxicity of gold nanorods: molecular origin of cytotoxicity and surface effects. Small. 2009;5:701–708. doi: 10.1002/smll.200801546. - DOI - PubMed
    1. Cho EC, Au L, Zhang Q, Xia Y. The effects of size, shape, and surface functional group of gold nanostructures on their adsorption and internalization by cells. Small. 2010;6:517–522. doi: 10.1002/smll.200901622. - DOI - PMC - PubMed

Publication types