. 2013;8(1):e55187.
doi: 10.1371/journal.pone.0055187. Epub 2013 Jan 28.

Microcarrier-based expansion of adult murine side population stem cells

Affiliations

Microcarrier-based expansion of adult murine side population stem cells

Christina A Pacak et al. PLoS One. 2013.

Abstract

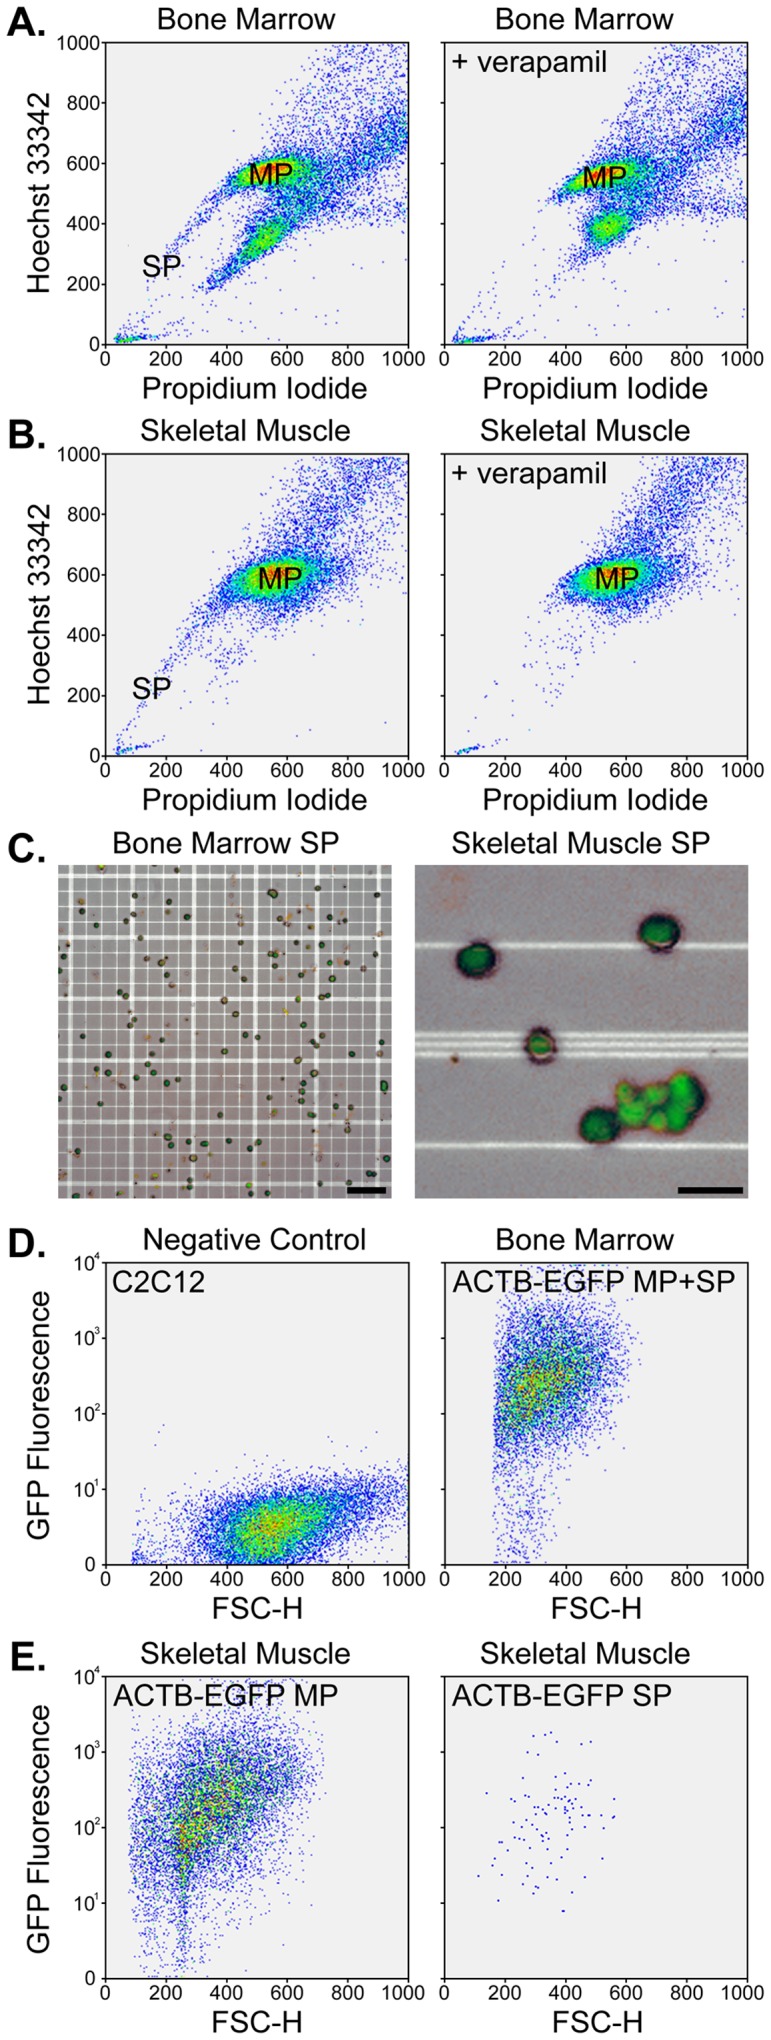
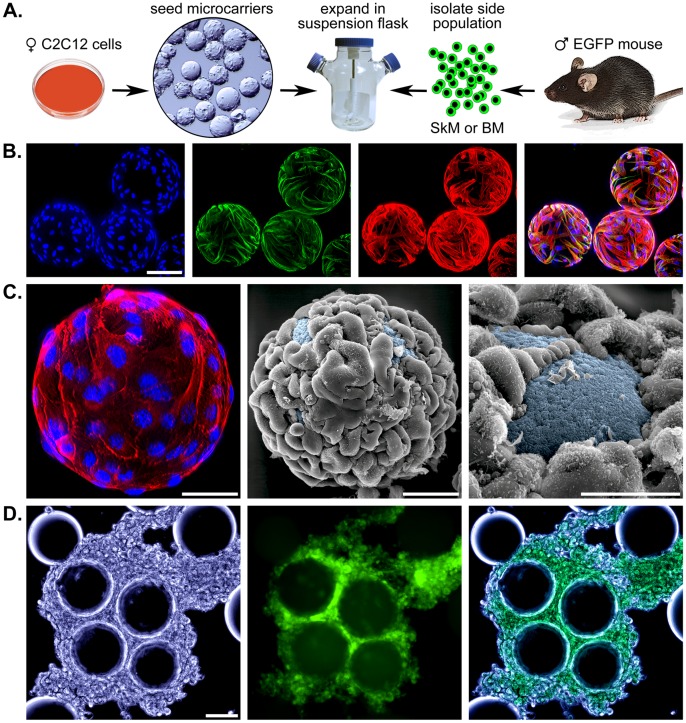
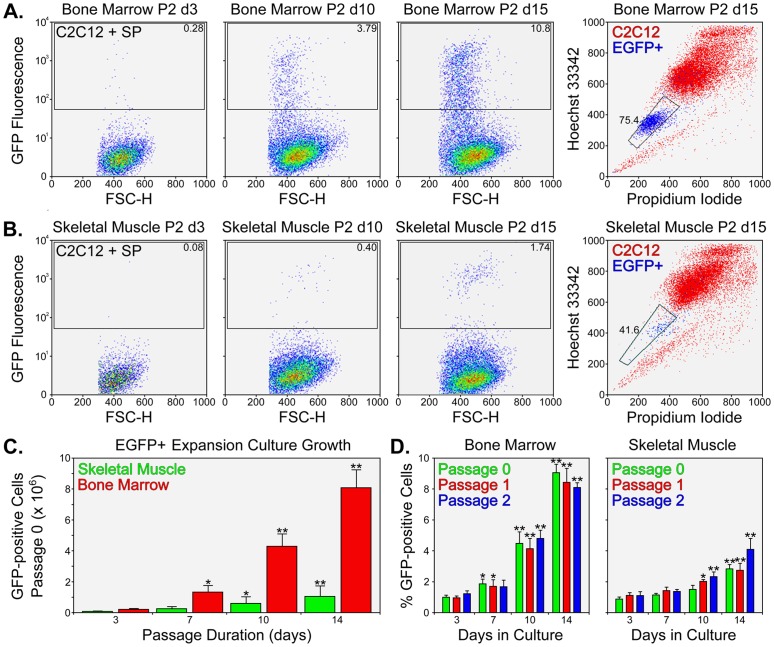
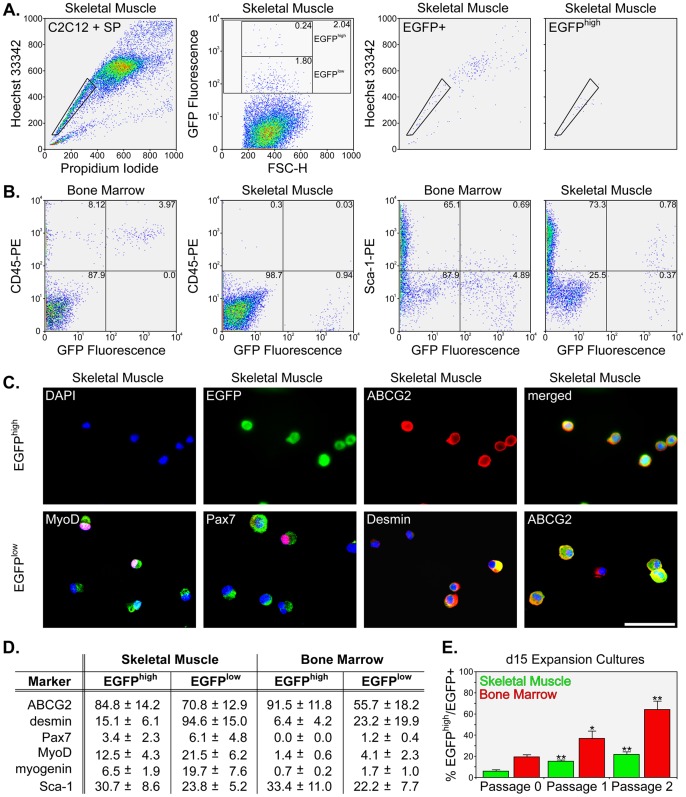
The lack of reliable methods to efficiently isolate and propagate stem cell populations is a significant obstacle to the advancement of cell-based therapies for human diseases. One isolation technique is based on efflux of the fluorophore Hoechst 33342. Using fluorescence-activated cell sorting (FACS), a sub-population containing adult stem cells has been identified in a multitude of tissues in every mammalian species examined. These rare cells are referred to as the 'side population' or SP due to a distinctive FACS profile that results from weak staining by Hoechst dye. Although the SP contains multi-potent cells capable of differentiating toward hematopoietic and mesenchymal lineages; there is currently no method to efficiently expand them. Here, we describe a spinner-flask culture system containing C2C12 myoblasts attached to spherical microcarriers that act to support the growth of non-adherent, post-natal murine skeletal muscle and bone marrow SP cells. Using FACS and hemocytometry, we show expansion of unfractionated EGFP⁺ SP cells over 6 wks. A significant number of these cells retain characteristics of freshly-isolated, unfractionated SP cells with respect to protein expression and dye efflux capacity. Expansion of the SP will permit further study of these heterogeneous cells and determine their therapeutic potential for regenerative and reparative therapies.


Conflict of interest statement

Competing Interests: The authors have declared that no competing interests exist.

Figures

Figure 1
Figure 1. Isolation of SP cells from murine bone marrow and skeletal muscle.
A – Representative FACS plots of bone marrow cells stained with Hoechst 33342 and PI. All plots show 20,000 events. Addition of verapamil eliminated the SP. The linear X and Y axes show PI and Hoechst staining, respectively. B – Representative FACS plots of skeletal muscle cells stained with Hoechst 33342 and PI (20,000 events per plot) in the absence (left) or presence (right) of verapamil. C – The appearance of bone marrow (left) and skeletal muscle (right) SP cells under combined bright field and fluorescence illumination. EGFP-expressing SP cells are shown on a hemocytometer grid and scale bars represent 50 µm (left) and 10 µm (right). D – Representative intrinsic fluorescence in C2C12 cells and unfractionated bone marrow from EGFP-expressing mice. The X axis depicts forward scatter (FSC-H) using a linear scale and the Y axis shows fluorescence using a logarithmic scale. E – Representative fluorescence in MP and SP fractions in enzymatically-digested skeletal muscle from ACTB-EGFP transgenic mice.
Figure 2
Figure 2. Appearance of microcarrier-based cultures from stirred-flasks.
A – A schematic representation of the initial steps in establishing a SP expansion culture. ♀ C2C12 myoblasts are expanded and seeded on 500,000 Cytodex 1 microcarriers (left). After attachment to the microcarrier surface, cultures are transferred to 100 mL flasks and maintained for 2–3 days. Freshly-isolated bone marrow (BM) or skeletal muscle (SkM) SP cells isolated from ♂ EGFP-expressing mice are added and stirred at 30 rpm. B – Fluorescent staining of C2C12-containing Cytodex 1 microcarriers using DAPI (blue), an α-sarcomeric actin antibody detected with a conjugated secondary antibody (green), and Texas Red-X phalloidin (red). The combined image is on the right and the scale bar represents 100 µm. C – A closer view of a cellularized microcarrier stained for F-actin and DNA (left) as well as 2 scanning electron micrographs (SEMs). The SEMs were pseudo-colored to emphasize the dextran matrix on the microcarrier surface. Scale bars equal 100 µm (left and center) and 50 µm (right). D – Differential interference contrast, fluorescence, and combined images of day 18 co-cultures of SP cells from bone marrow and myoblast feeder cells. Scale bar equals 100 µm.
Figure 3
Figure 3. Expansion of bone marrow and skeletal muscle SP cells in suspension.
A – Representative FACS plots of P2 bone marrow suspension culture analyses for EGFP-fluorescence at days 3, 10, and 15 (left). Plots show 20,000 events. Day 15 cells were assessed for Hoechst dye effusion (right). Plots show 50,000 events. B – FACS plots of P2 skeletal muscle culture analyses for EGFP-fluorescence at days 3, 10, and 15 (left). Day 15 cells were assessed for Hoechst dye effusion (right). Both bone marrow and skeletal muscle expansion cultures demonstrated an increase in EGFP+ cells over time and many cells were Hoechstlow, analogous to freshly-isolated SP cells. C – Expansion of EGFP+ cells in P0 stirred-flask cultures as determined by hemocytometry. Numerical values for the total number of EGFP+ cells are expressed as Mean ± SD (n = 4) and asterisks represent statistical significance (* P<0.05 and ** P<0.01) compared to day 3 values. D – Expansion of bone marrow (left) and skeletal muscle (right) EGFP+ cells over the course of 3 passages (P0, P1, and P2). The percentage of EGFP+ cells in the suspension cultures is expressed as Mean ± SD (n = 4) and asterisks represent statistical significance (* P<0.05 and ** P<0.01) compared to day 3 values.
Figure 4
Figure 4. Phenotypic characterization of stirred-flask expansion cultures.
A – Representative FACS plots of P0 skeletal muscle expansion cultures. The increase in the typical SP gate position in day 15 cultures is shown (left). The plot shows 50,000 events. By day 10, the appearance of a highly-fluorescent (EGFPhigh) sub-population was apparent in EGFP+ cells and these were found to sort nearly exclusively to the SP gate (right). The EGFPlow cells were distributed in typical SP and MP positions. B – Representative FACS analyses of surface marker expression in P2 bone marrow and P3 skeletal muscle cultures. Plots show 20,000 events. CD45 (left) and Sca-1 (right) profiles plotted against GFP fluorescence are shown for unfractionated aliquots of the suspension cultures. C – Representative immuno-staining results from Cytospin preparations for the EGFPhigh (top) and EGFPlow (bottom) sub-populations from skeletal muscle. The EGFPhigh images show separate channels depicting DNA staining, GFP fluorescence, ABCG2 immuno-staining, and a combination of fluorescent channels (left to right). EGFPlow images represent the same channels except the red channel shows immuno-staining with MyoD, Pax7, desmin, and ABCG2 (left to right). Scale bars equal 25 µm. D – A summary of immuno-staining experiments for ABCG2, desmin, Pax7, MyoD, myogenin, and Sca-1 in EGFPhigh and EGFPlow sub-populations. Percentage values are expressed as Mean ± SD (n = 6). E – A graph showing the increase in the EGFPhigh sub-population in skeletal muscle and bone marrow cultures at the end of P0, P1, and P2. The percentage of EGFPhigh cells in the EGFP+ fraction is expressed as Mean ± SD (n = 5) and asterisks represent statistical significance (* P<0.05 and ** P<0.01) compared to day 15 P0 values.

Similar articles

Cited by

References

    1. Goodell MA, Brose K, Paradis G, Conner AS, Mulligan RC (1996) Isolation and functional properties of murine hematopoietic stem cells that are replicating in vivo. J Exp Med 183: 1797–1806. - PMC - PubMed
    1. Asakura A, Seale P, Girgis-Gabardo A, Rudnicki MA (2002) Myogenic specification of side population cells in skeletal muscle. J Cell Biol 159: 123–134. - PMC - PubMed
    1. Asakura A, Rudnicki MA (2002) Side population cells from diverse adult tissues are capable of in vitro hematopoietic differentiation. Exp Hematol 30: 1339–1345. - PubMed
    1. Liadaki K, Kho AT, Sanoudou D, Schienda J, Flint A, et al. (2005) Side population cells isolated from different tissues share transcriptome signatures and express tissue-specific markers. Exp Cell Res 303: 360–374. - PubMed
    1. Unno K, Jain M, Liao R (2012) Cardiac side population cells: moving toward the center stage in cardiac regeneration. Circ Res 110: 1355–1363. - PMC - PubMed

Publication types

Substances