. 2013 Mar 1;126(Pt 5):1247-59.
doi: 10.1242/jcs.120592. Epub 2013 Feb 1.

Depletion of PtdIns(4,5)P₂ underlies retinal degeneration in Drosophila trp mutants

Affiliations

Depletion of PtdIns(4,5)P₂ underlies retinal degeneration in Drosophila trp mutants

Sukanya Sengupta et al. J Cell Sci. .

Abstract

The prototypical transient receptor potential (TRP) channel is the major light-sensitive, and Ca(2+)-permeable channel in the microvillar photoreceptors of Drosophila. TRP channels are activated following hydrolysis of phosphatidylinositol 4,5-bisphosphate [PtdIns(4,5)P₂] by the key effector enzyme phospholipase C (PLC). Mutants lacking TRP channels undergo light-dependent retinal degeneration, as a consequence of the reduced Ca(2+) influx. It has been proposed that degeneration is caused by defects in the Ca(2+)-dependent visual pigment cycle, which result in accumulation of toxic phosphorylated metarhodopsin-arrestin complexes (MPP-Arr2). Here we show that two interventions, which prevent accumulation of MPP-Arr2, namely rearing under red light or eliminating the C-terminal rhodopsin phosphorylation sites, failed to rescue degeneration in trp mutants. Instead, degeneration in trp mutants reared under red light was rescued by mutation of PLC. Degeneration correlated closely with the light-induced depletion of PtdIns(4,5)P₂ that occurs in trp mutants due to failure of Ca(2+)-dependent inhibition of PLC. Severe retinal degeneration was also induced in the dark in otherwise wild-type flies by overexpression of a bacterial PtdInsPn phosphatase (SigD) to deplete PtdIns(4,5)P₂. In degenerating trp photoreceptors, phosphorylated Moesin, a PtdIns(4,5)P₂-regulated membrane-cytoskeleton linker essential for normal microvillar morphology, was found to delocalize from the rhabdomere and there was extensive microvillar actin depolymerisation. The results suggest that compromised light-induced Ca(2+) influx, due to loss of TRP channels, leads to PtdIns(4,5)P₂ depletion, resulting in dephosphorylation of Moesin, actin depolymerisation and disintegration of photoreceptor structure.


Figures

Fig. 1.
Fig. 1.
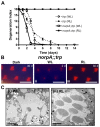
Retinal degeneration under white light. (A) Time course of retinal degeneration in wild type, norpAP24, and two independent trp mutants (trp343 and trpCM) under continuous white light (n = 5–7, means ± s.e.m.). (B) Representative optical neutralisation images of wild-type and mutant retinae after the indicated number of days (d) under continuous white light (WL) or darkness (Dark). (i,ii) Wild-type strain, Oregon R; (iii,iv) norpAP24; (v,vi) trp343 mutant. Scale bar: ∼16 µm. (C) Transmission electron microscopy (i,ii) Wild-type retina shows normal morphology after 5 days continuous white illumination. (iii,iv) norpAP24 retina exposed to white light for 5 days has short microvilli, but microvillar structure is still largely intact; (v,vi) trpCM retina exposed to white light for 5 days shows highly disintegrated microvilli giving a frothy appearance (black arrow). The rhabdomere of the UV-sensitive central photoreceptor (R7) in both mutants is spared from degeneration. Scale bars: ∼2 µm (Ci,iii,v); ∼500 nm (Cii,iv,vi).
Fig. 2.
Fig. 2.
Effect of expressing phosphorylation-deficient ninaE (ninaEΔ356) and red light on retinal degeneration in trp and norpA mutants. (A) Time course of retinal degeneration in wild-type, norpAP24 and two independent trp (trpCM and trp343) mutants under continuous red light. Also shown is the time course of degeneration in white-eyed trp343 mutants (evaluated by counting the fraction of flies with intact deep pseudopupils, and normalised to the same scale). Exposure to red light rescues retinal degeneration in norpA but not in trp flies. (B) Representative optical neutralization images of red-eyed wild-type (i), norpAP24 (ii), and trp343 (iii) retinae. (C,D) Expression of ninaEΔ356 in an otherwise ninaE null (ninaEEI17) background suppressed norpA retinal degeneration, but failed to rescue trp degeneration. (C) Time course of retinal degeneration in all mutants under continuous white light (means ± s.e.m., n>15). (D) Representative optical neutralisation images of trp (i), norpAP24 (ii), trpCM, ninaEEI17, P-ninaEΔ356 (iii), norpAP24;;ninaEEI17, P-ninaEΔ356 (iv), ninaEEI17, P-ninaEΔ356 (v) retinae. Scale bars: ∼16 µm.
Fig. 3.
Fig. 3.
Ultrastructural pathology of the degenerating photoreceptors of trp343 mutants. (A) Wild-type dark control (∼28 days). (B) Intact photoreceptors of trp343 mutants maintained in the dark for ∼30 days. (C–H) trp343 mutants exposed to red light for different time periods. (C) 7 days exposure. (D) 30 days exposure. trp retina shows disrupted rhabdomere structure of peripheral photoreceptors. R7, the UV-sensitive photoreceptor, is intact. Blue arrowheads indicate the cell junctions. (E,F) 7 days exposure. Degenerating trp photoreceptors with multivesicular bodies (MVBs), endosomes and a lysosome (L). (G) 14 days exposure. Photoreceptor cell with completely fragmented microvilli being engulfed by a pigment cell (P), identified by their homogenous, granular appearance. Some phagocytosed material (*) can also be observed, which is possibly the remnant of a neighbouring degenerated photoreceptor cell. (H) 30 days exposure. Large vacuoles have appeared in the photoreceptors, but the cell junctions (blue arrow) are intact. N, nucleus; R, rhabdomeres; G, Golgi complex. Scale bars: ∼2 µm (A–E,G,H); ∼500 nm (F).
Fig. 4.
Fig. 4.
Eliminating PLC activity rescues retinal degeneration induced by red light in trp mutants. (A) Time course of retinal degeneration in norpAP24;;trp343 and trp343 flies under continuous white and red light (n>15, means ± s.e.m.). Retinal degeneration in trp mutants under red light was rescued by blocking PtdIns(4,5)P2 hydrolysis. (B) Representative optical neutralisation images of norpAP24;;trp343 retinae kept in the dark (i), white light (WL; ii) and red light (RL; iii). Scale bars: ∼16 µm. (C) Representative TEM of norpAP24;trpCM mutants reared for 6 days in white light (i); apart from R7, the rhabdomeres have largely degenerated; but under red light (ii) essentially wild-type morphology is preserved. Scale bars: 2 µm.
Fig. 5.
Fig. 5.
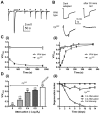
PtdIns(4,5)P2 depletion and retinal degeneration in trp mutants. (A) ERG recording from a trp mutant using a standard ERG set up. trp mutants show response inactivation to 200 ms dim test flashes (arrowheads) after prolonged illumination of 30 s (bar), reflecting PtdIns(4,5)P2 depletion (Hardie et al., 2001). The response gradually recovered, representing regeneration of PtdIns(4,5)P2. (B,C) PtdIns(4,5)P2 depletion in trp mutants under degenerative condition. (B) Representative traces from a wild type, and a trp mutant before (dark-adapted) and ∼5 s after exposure to the red LED in a light box for 30 minutes. (Ci) ERG amplitude response to a test flash as a function of duration of exposure to red LED, normalized to dark-adapted response prior to exposure (V/Vmax). 30 mins exposure caused near complete response inactivation (PtdIns(4,5)P2 depletion) in trp mutants but not in wild-type flies. (Cii) Response recovery after 30 mins of red light exposure (n = 5, means ± s.e.m.). (D) Intensity dependence of response inactivation (V/Vmax), reflecting PtdIns(4,5)P2 depletion (i), and retinal degeneration (ii) in trp mutants. Severity of PtdIns(4,5)P2 depletion (means ± s.e.m., n indicated in brackets) and retinal degeneration in trp (n≥7, means ± s.e.m.) had similar intensity dependence.
Fig. 6.
Fig. 6.
Retinal degeneration in flies expressing the Salmonella PtdInsPn-phosphatase gene, SigD. Optical neutralisation (A) and TEM (B) images of fly retinae expressing Salmonella SigD and its catalytically inactive form SigDdead, under the Rh1 promoter. (Aii,Bi,ii) Transgenic flies expressing two copies SigD show severe retinal degeneration, with fragmented rhabdomeres and degenerating photoreceptors being engulfed by a neighbouring pigment cell (*). (B,i,ii) R7 photoreceptors (arrows), where SigD is not expressed, are normal. (Aiii,Biii) The retina is normal in flies expressing the catalytically inactive SigDdead Scale bars: ∼16 mm (A); ∼2 µm (B).
Fig. 7.
Fig. 7.
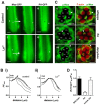
Depletion of dMoesin from rhabdomere bases following red light exposure in the absence of TRP channels. (A) (i) Dissociated live ommatidia (∼2/3 of ommatidial length imaged, distal ends downwards) expressing GFP-tagged Moesin after continuous red illumination for 3–20 min in control bath (top row) and in the presence of 100 µM La3+, which phenocopies the trp mutation by blocking all TRP channels (bottom row). Note the prominent stripes of fluorescence at the base of the rhabdomeres (small arrows), which are no longer seen after red illumination in the presence of La3+ (two examples shown; representative of 18 control and 24 La3+-treated ommatidia). (ii) Ommatidia expressing the PtdIns(4,5)P2-binding PH domain from PLCδ1 (PH–GFP). In control solutions PH–GFP remained localized to the rhabdomeres (r) after red illumination; but in La3+-treated ommatidia (below) it had translocated to the cell body (c), indicating severe depletion of PtdIns(4,5)P2 in the rhabdomeres (representative of 4–7 ommatidia in each condition). See also supplementary material Movies 1 and 2. Scale bars: 5 µm. (B) Representative intensity profiles (averaged line scans from rhabdomere to periphery at 90° to rhabdomere long axis, as indicated by large arrows in A from five control ommatidia (i) and five ommatidia exposed to La3+ (ii); a sharp peak representing the stripe of Moesin (arrow) adjacent to the rhabdomere (indicated by double arrow) is only apparent in control. (C) Transverse confocal slices of ommatidia from fixed whole-mount preparations of eyes exposed to red light for 2 hours. The retinae were probed with anti p-Moe (green), and Rhodamine-conjugated phalloidin (red), which labels actin in the rhabdomeres. Left: p-Moe alone; right: merged images. (i) In the wild-type retina, p-Moe is concentrated in a band at the base of the rhabdomeres (white arrowhead). (ii) In the trp343 retina, the white arrow indicates the absence of p-Moe from the bases of rhabdomeres R1–R6 . R7, which does not respond to red light retains the band at the base (white arrowhead). (iii) Localization of p-Moe to the base of the rhabdomeres was rescued in norpAP24;;trp343 double mutants. Scale bars: ∼2 µm. (D) Quantification of the fluorescence intensity in the basal band of p-Moe immunofluorescence in R1–R6 normalised to that in R7, which served as an internal standard (means ± s.e.m. of nine ommatidia from three flies).
Fig. 8.
Fig. 8.
Loss of F-actin in trp mutant retina exposed to light. (A,A′) Transverse confocal slices of wild-type ommatidium after 24 hours of red light (LED-light box) exposure. The retinae were doubly probed with Rhodamine-conjugated phalloidin (red) and a monoclonal antibody against rhodopsin (4C5, green). (A′) Overlay of both the markers in a wild-type retina. (B–F) Phalloidin labelling of trp343 retinae after exposure to red light for 2 hours (B), 4 hours (C), 8 hours (D), 24 hours (E), and kept in the dark for 24 hours (F). (B′–F′) Merged images (overlay of phalloidin and rhodopsin staining) of the ommatidia in B–F. Scale bars ∼2 µm, n = 3 to 4. (G) Quantification of phalloidin fluorescence intensity in rhabdomeres R1–R6, expressed as a fraction of fluorescence intensity in R7, which served as an internal standard (means ± s.e.m. of nine ommatidia from three flies).
Fig. 9.
Fig. 9.
Mechanisms underlying retinal degeneration. (A) TRP channels are activated downstream of PtdIns(4,5)P2 hydrolysis by PLC. Loss of TRP channels in trp mutants eliminates the Ca2+ influx, which normally inhibits PLC (norpA gene) via Ca2+-dependent PKC (Gu et al., 2005) (red crosses indicate Ca2+ influx and sites of Ca2+-dependent feedback disrupted by the trp mutation). As a result, PtdIns(4,5)P2 in the microvilli is depleted even by red light, leading to degeneration. Downstream mechanisms include p-Moe dephosphorylation, possible defects in other actin organizing proteins, F-actin depolymerisation and microvillar disorganization. (B) Visual pigment cycle: rhodopsin (R) is photoisomerised by blue light to metarhodopsin (M). M is phosphorylated (MPP) by rhodopsin kinase (RK) and inactivated by binding to arrestin (Arr2), which is phosphorylated by CaMKII. Mpp is photoreisomerised to Rpp by red light, which prevents any possible accumulation of MPP–Arr2. Rpp and MPP are dephosphorylated by a Ca2+/CaM-dependent phosphatase encoded by rdgC. In low Ca2+, Arr2 is not phosphorylated, whilst RPP (or MPP) cannot be dephosphorylated (red crosses). Under white or blue light this results in accumulation of MPP–Arr2, which is a target for clathrin-mediated endocytosis. This is believed to underlie degeneration in norpA, rdgC and some other blind mutants (Alloway et al., 2000; Kiselev et al., 2000). This may also contribute to degeneration in trp mutants reared under white light (Wang et al., 2005). However because clathrin-mediated endocytosis is also PtdIns(4,5)P2 dependent this requires further investigation.

Similar articles

Cited by

References

    1. Alloway P. G., Dolph P. J. (1999). A role for the light-dependent phosphorylation of visual arrestin. Proc. Natl. Acad. Sci. USA 96, 6072–6077 10.1073/pnas.96.11.6072 - DOI - PMC - PubMed
    1. Alloway P. G., Howard L., Dolph P. J. (2000). The formation of stable rhodopsin-arrestin complexes induces apoptosis and photoreceptor cell degeneration. Neuron 28, 129–138 10.1016/S0896-6273(00)00091-X - DOI - PubMed
    1. Barret C., Roy C., Montcourrier P., Mangeat P., Niggli V. (2000). Mutagenesis of the phosphatidylinositol 4,5-bisphosphate (PIP(2)) binding site in the NH(2)-terminal domain of ezrin correlates with its altered cellular distribution. J. Cell Biol. 151, 1067–1080 10.1083/jcb.151.5.1067 - DOI - PMC - PubMed
    1. Berryman M., Franck Z., Bretscher A. (1993). Ezrin is concentrated in the apical microvilli of a wide variety of epithelial cells whereas moesin is found primarily in endothelial cells. J. Cell Sci. 105, 1025–1043 - PubMed
    1. Bretscher A. (1999). Regulation of cortical structure by the ezrin-radixin-moesin protein family. Curr. Opin. Cell Biol. 11, 109–116 10.1016/S0955-0674(99)80013-1 - DOI - PubMed

Publication types

MeSH terms

LinkOut - more resources