

Down-regulation of CTLA-4 by HIV-1 Nef protein
- PMID: 23372701
- PMCID: PMC3553160
- DOI: 10.1371/journal.pone.0054295
Down-regulation of CTLA-4 by HIV-1 Nef protein
Abstract
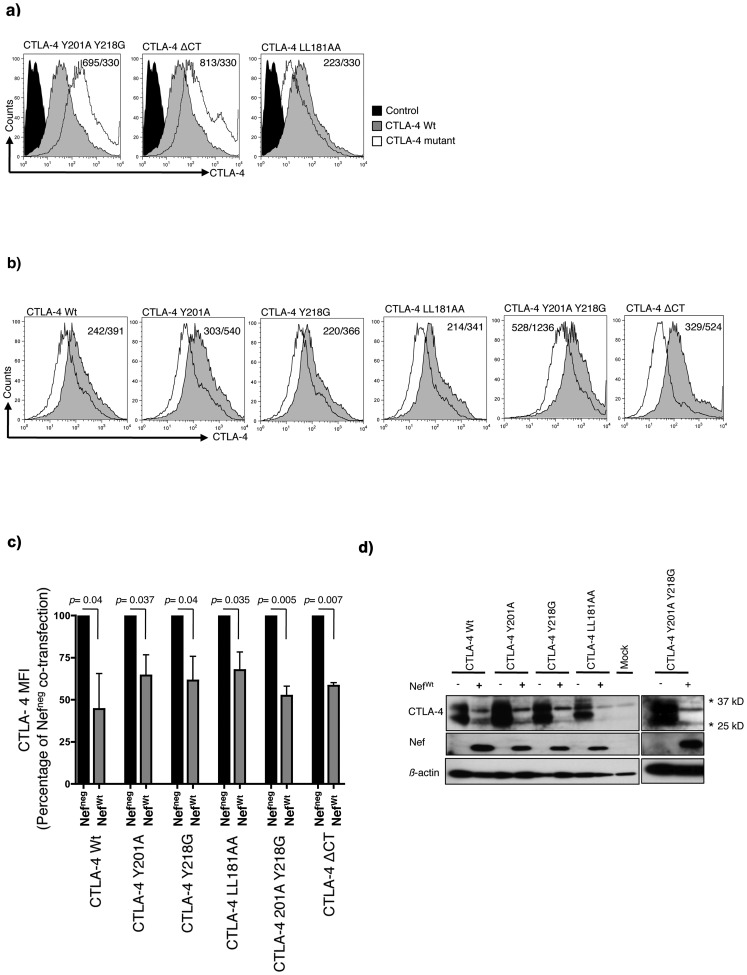
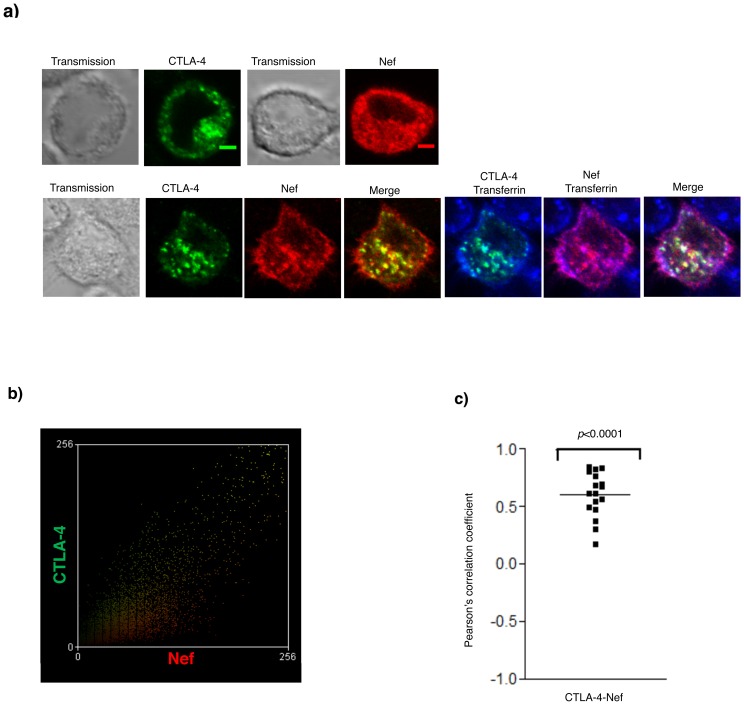
HIV-1 Nef protein down-regulates several cell surface receptors through its interference with the cell sorting and trafficking machinery. Here we demonstrate for the first time the ability of Nef to down-regulate cell surface expression of the negative immune modulator CTLA-4. Down-regulation of CTLA-4 required the Nef motifs DD175, EE155 and LL165, all known to be involved in vesicle trafficking. Disruption of the lysosomal functions by pH-neutralizing agents prevented CTLA-4 down-regulation by Nef, demonstrating the implication of the endosomal/lysosomal compartments in this process. Confocal microscopy experiments visualized the co-localization between Nef and CTLA-4 in the early and recycling endosomes but not at the cell surface. Overall, our results provide a novel mechanism by which HIV-1 Nef interferes with the surface expression of the negative regulator of T cell activation CTLA-4. Down-regulation of CTLA-4 may contribute to the mechanisms by which HIV-1 sustains T cell activation, a critical step in viral replication and dissemination.
Conflict of interest statement
Figures


Similar articles
-
Interaction of HIV-1 Nef protein with the host protein Alix promotes lysosomal targeting of CD4 receptor.J Biol Chem. 2014 Oct 3;289(40):27744-56. doi: 10.1074/jbc.M114.560193. Epub 2014 Aug 12. J Biol Chem. 2014. PMID: 25118280 Free PMC article.
-
HIV-1 Nef Antagonizes SERINC5 Restriction by Downregulation of SERINC5 via the Endosome/Lysosome System.J Virol. 2018 May 14;92(11):e00196-18. doi: 10.1128/JVI.00196-18. Print 2018 Jun 1. J Virol. 2018. PMID: 29514909 Free PMC article.
-
CD4 downregulation by the HIV-1 protein Nef reveals distinct roles for the γ1 and γ2 subunits of the AP-1 complex in protein trafficking.J Cell Sci. 2017 Jan 15;130(2):429-443. doi: 10.1242/jcs.192104. Epub 2016 Dec 1. J Cell Sci. 2017. PMID: 27909244
-
Structure, function, and inhibitor targeting of HIV-1 Nef-effector kinase complexes.J Biol Chem. 2020 Oct 30;295(44):15158-15171. doi: 10.1074/jbc.REV120.012317. Epub 2020 Aug 29. J Biol Chem. 2020. PMID: 32862141 Free PMC article. Review.
-
HIV-1 Nef: Taking Control of Protein Trafficking.Traffic. 2016 Sep;17(9):976-96. doi: 10.1111/tra.12412. Epub 2016 Jun 3. Traffic. 2016. PMID: 27161574 Review.
Cited by
-
Unequal distribution of genetically-intact HIV-1 proviruses in cells expressing the immune checkpoint markers PD-1 and/or CTLA-4.Front Immunol. 2023 Jan 26;14:1064346. doi: 10.3389/fimmu.2023.1064346. eCollection 2023. Front Immunol. 2023. PMID: 36776833 Free PMC article.
-
Concanamycin A counteracts HIV-1 Nef to enhance immune clearance of infected primary cells by cytotoxic T lymphocytes.Proc Natl Acad Sci U S A. 2020 Sep 22;117(38):23835-23846. doi: 10.1073/pnas.2008615117. Epub 2020 Sep 8. Proc Natl Acad Sci U S A. 2020. PMID: 32900948 Free PMC article.
-
Microbial Translocation Does Not Drive Immune Activation in Ugandan Children Infected With HIV.J Infect Dis. 2019 Jan 1;219(1):89-100. doi: 10.1093/infdis/jiy495. J Infect Dis. 2019. PMID: 30107546 Free PMC article.
-
The autophagy protein ATG9A promotes HIV-1 infectivity.Retrovirology. 2019 Jul 3;16(1):18. doi: 10.1186/s12977-019-0480-3. Retrovirology. 2019. PMID: 31269971 Free PMC article.
-
HIV-1 Nef down-modulates C-C and C-X-C chemokine receptors via ubiquitin and ubiquitin-independent mechanism.PLoS One. 2014 Jan 29;9(1):e86998. doi: 10.1371/journal.pone.0086998. eCollection 2014. PLoS One. 2014. PMID: 24489825 Free PMC article.
References
-
- Malim MH, Emerman M (2008) HIV-1 accessory proteins–ensuring viral survival in a hostile environment. Cell Host Microbe 3: 388–398. - PubMed
-
- Aiken C, Konner J, Landau NR, Lenburg ME, Trono D (1994) Nef induces CD4 endocytosis: requirement for a critical dileucine motif in the membrane-proximal CD4 cytoplasmic domain. Cell 76: 853–864. - PubMed
-
- Arold ST, Baur AS (2001) Dynamic Nef and Nef dynamics: how structure could explain the complex activities of this small HIV protein. Trends Biochem Sci 26: 356–363. - PubMed
-
- Benichou S, Bomsel M, Bodeus M, Durand H, Doute M, et al. (1994) Physical interaction of the HIV-1 Nef protein with beta-COP, a component of non-clathrin-coated vesicles essential for membrane traffic. J Biol Chem 269: 30073–30076. - PubMed
Publication types
MeSH terms
Substances
Grants and funding
LinkOut - more resources
Full Text Sources
Other Literature Sources
